
Everyone in property says off-market is a thing. Agents say it to vendors. Buyers agents say it to buyers, and we are no exception. What nobody shows you is the number: in your suburb, for the kind of home you want, how many sales never had a listing at all?
We went looking. Cotality (formerly CoreLogic) publishes a suburb statistics report for every suburb we cover. Each one counts, for the past 12 months and for houses and apartments separately, the properties that sold and the properties that were newly listed for sale. Where more homes sold than were listed, the difference is a floor under the number of sales that never had a new listing. We read all 76 reports across the Northern Beaches, the Lower North Shore and the Upper North Shore, and checked the sales counts against the NSW Valuer General's register.
Here is what the data says, and what it does not.
The short version
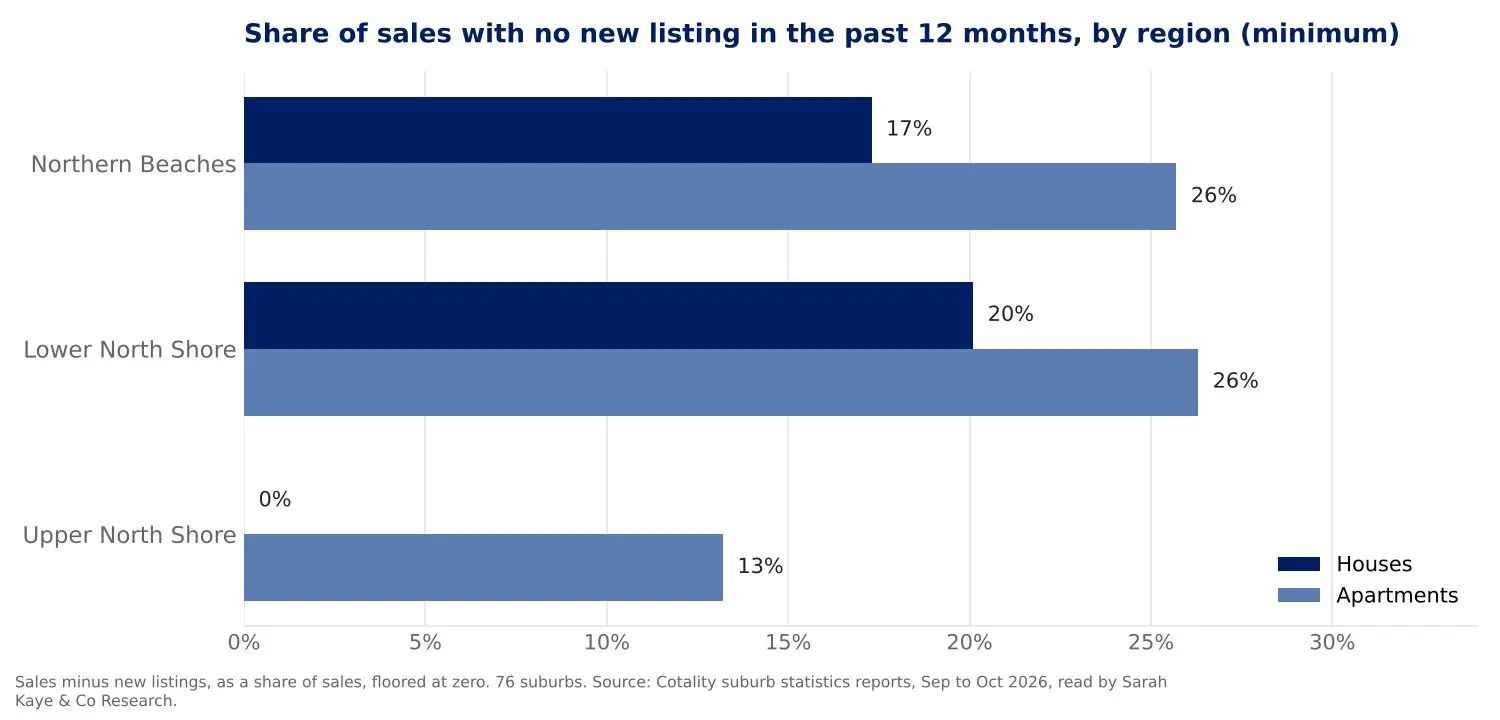
Across the 76 suburbs, at least 23 per cent of apartment sales and at least 12 per cent of house sales in the past year had no new listing. Those are floors, not estimates.
It is a Northern Beaches and Lower North Shore story. On the Upper North Shore, house listings outnumbered house sales.
The quiet suburbs are the family-home belts and the apartment belts, not the trophy end. At the top of the market, listings outnumber sales and homes sit for longer.
Fast markets run quietest. Where homes sell in 25 days or less, roughly a quarter of sales had no new listing.
Sydney's north, past 12 months
Floors, not estimates. The true share is higher; how much higher, nobody can say from the public record.
How we counted, and why the number is a floor
A home that sells without a listing leaves a trace: it appears in the sales count and not in the listings count. So for each suburb we took Cotality's properties sold over 12 months, subtracted its new sale listings over the same period, and expressed the gap as a share of sales.
Three honest caveats.
First, the two counts are not perfectly aligned in time. Some homes listed last spring sold inside this window; some listed this spring will sell after it. Cotality also reports a "total properties listed" figure that includes stock carried in from the previous year, and we used it as a second, stricter test. The regional pattern holds on both.
Second, the method only works one way. Where sales exceed listings, the gap is a minimum share of quiet sales. Where listings exceed sales, we learn nothing about off-market activity, only that stock was withdrawn or had not sold yet.
Third, "no new listing" is not quite the same as "off-market". It includes true off-market sales, pre-market sales agreed before a campaign launched, and sales through an agent's own database. PropTrack uses the same logic for its own research, defining an off-market sale as one it cannot match to a listing. We think the honest phrase is: these homes sold without being advertised to the public.
So when we say "at least 23 per cent", we mean it. The true figure is higher. How much higher, nobody can say from the public record.
By region: two different markets
| Region | Houses: sold / new listings | Apartments: sold / new listings |
|---|---|---|
| Northern Beaches (42 suburbs) | 2,324 / 1,923 at least 17% quiet | 2,277 / 1,691 at least 26% quiet |
| Lower North Shore (21) | 1,021 / 816 at least 20% quiet | 2,878 / 2,121 at least 26% quiet |
| Upper North Shore (13) | 1,322 / 1,359 0%: listings exceeded sales | 1,389 / 1,205 at least 13% quiet |
| All 76 | 4,667 / 4,098 at least 12% quiet | 6,544 / 5,017 at least 23% quiet |
The Upper North Shore is the market where nearly everything goes to the portals. It had more house listings than house sales over the year. If you are buying a house in Turramurra, Killara or Gordon, the portals show you most of what is for sale. Your edge is judgement and timing, not access.
The Northern Beaches and the Lower North Shore are different. One apartment sale in four, and one house sale in five or six, happened without a new listing. A buyer who only watches the portals is competing for a smaller pool than they think, and for the pool everyone else can see.
By suburb: the quiet pockets are not where people assume
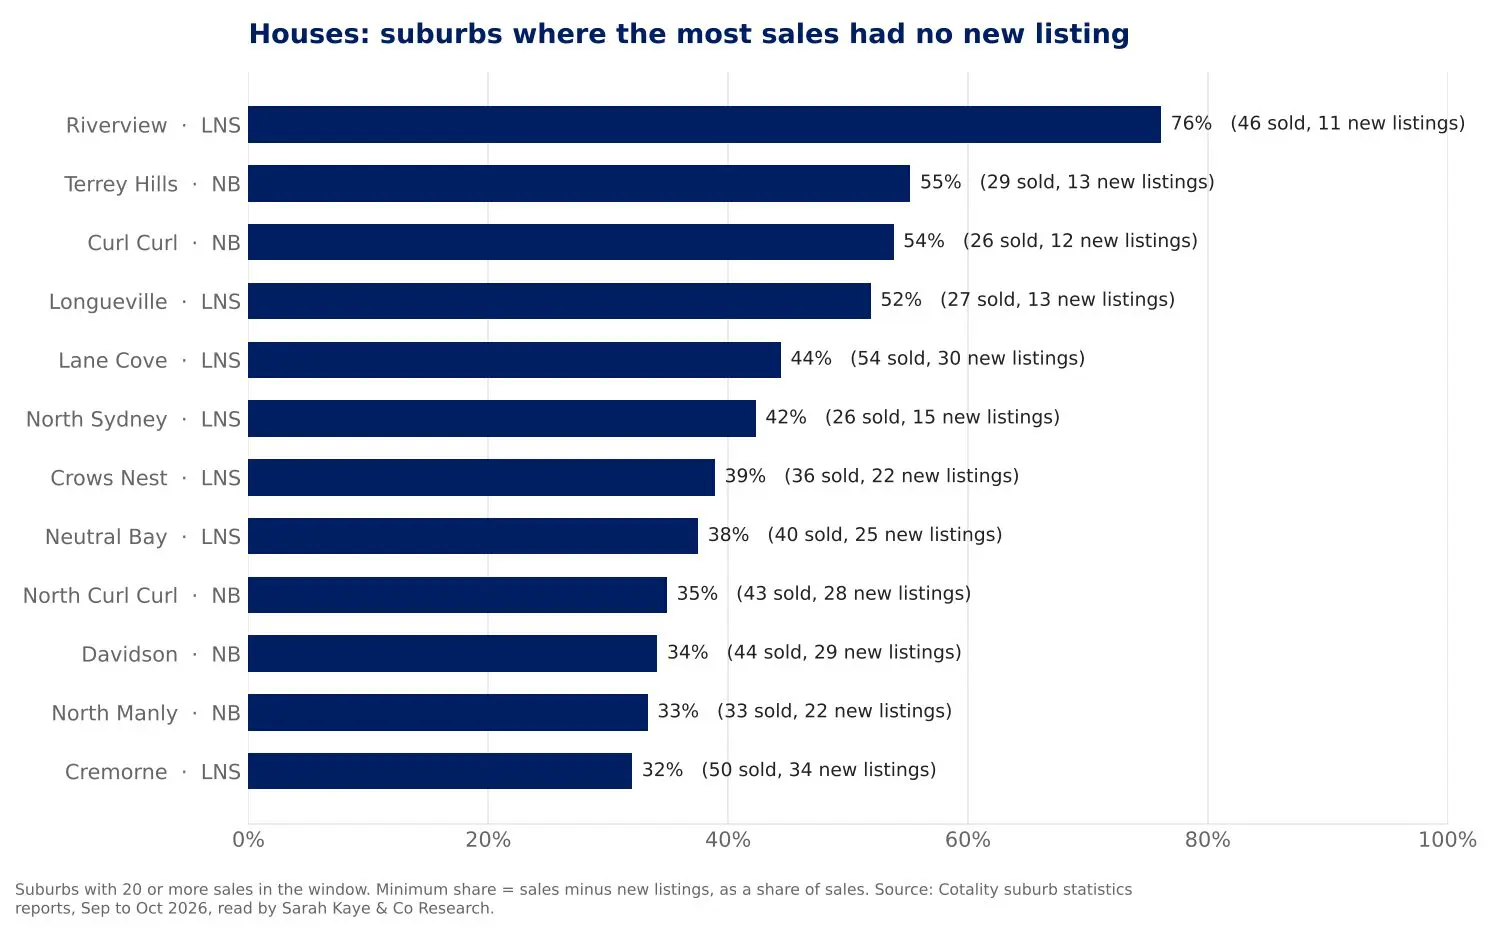
House suburbs with the highest minimum share of sales with no new listing. Suburbs with fewer than 20 house sales excluded. Riverview is a small suburb and its figure should be read as a direction, not a measurement.
The house suburbs with the highest quiet share are the tightly held family pockets: Terrey Hills, Curl Curl, Longueville, Lane Cove, North Sydney, Crows Nest, Neutral Bay, North Curl Curl, Davidson, North Manly, Cremorne, Manly Vale and Avalon Beach, each with roughly a third or more of house sales showing no new listing. Riverview sits at the top of the list at 76 per cent, but it is a small suburb, and we would treat that figure as a direction rather than a measurement until another year of data confirms it.
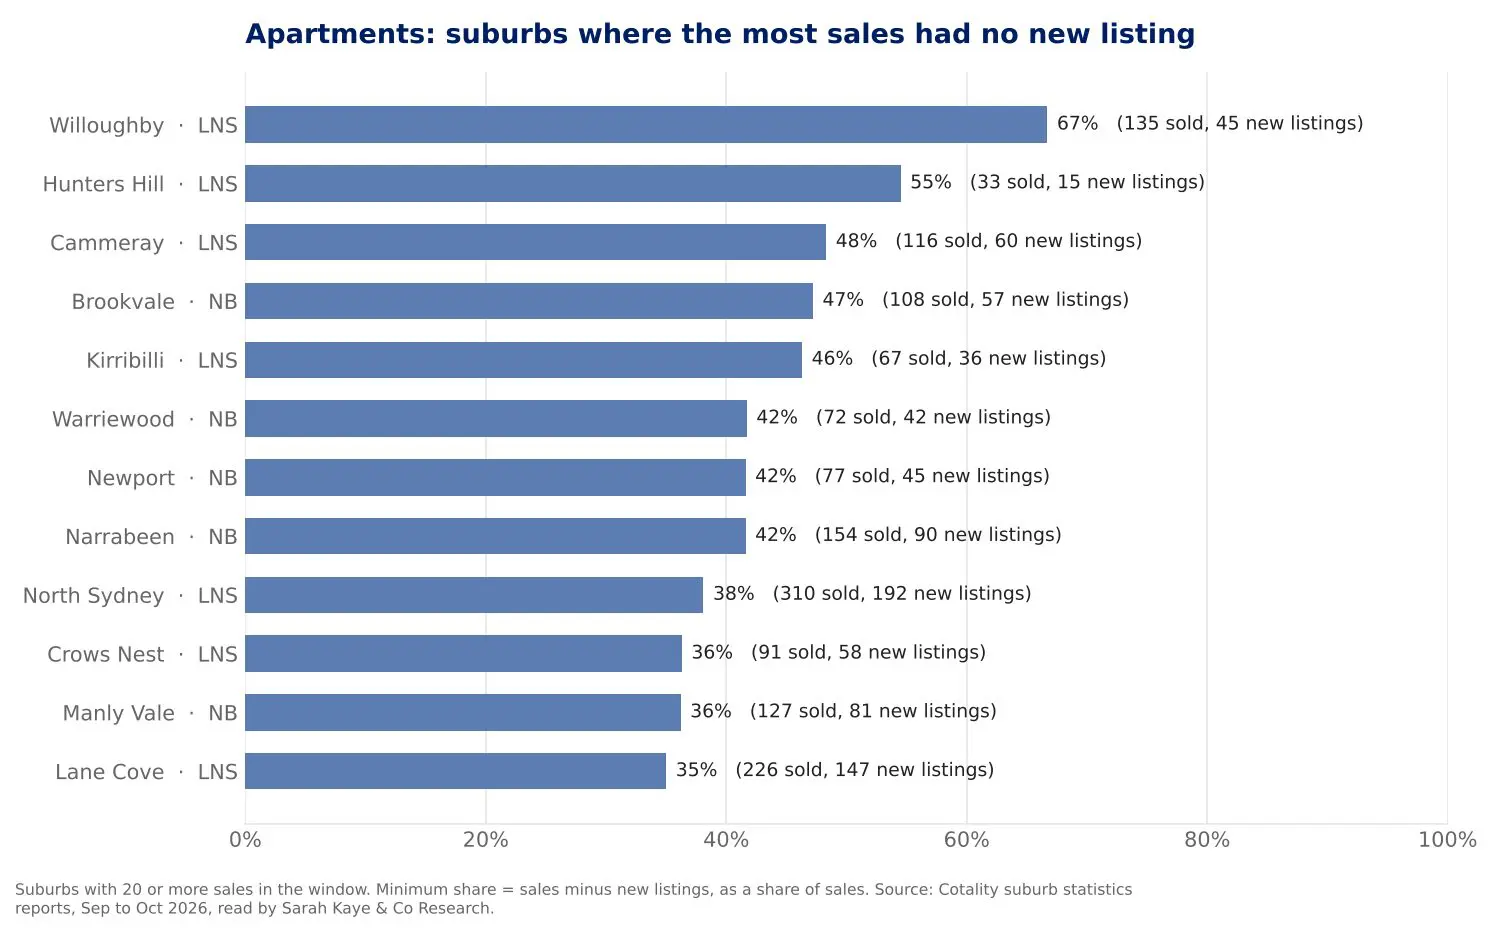
Apartment suburbs with the highest minimum share of sales with no new listing. Suburbs with fewer than 20 apartment sales excluded.
For apartments, the quiet markets are Willoughby, Cammeray, Brookvale, Kirribilli, Warriewood, Newport, Narrabeen and North Sydney, where between a third and two-thirds of sales had no new listing. These are not top-end markets. They are where owner-occupiers trade up and down within the same building or street, where strata managers and local agents know who is thinking of selling, and where a well-priced unit never needs a campaign.
The counter-story at the top end
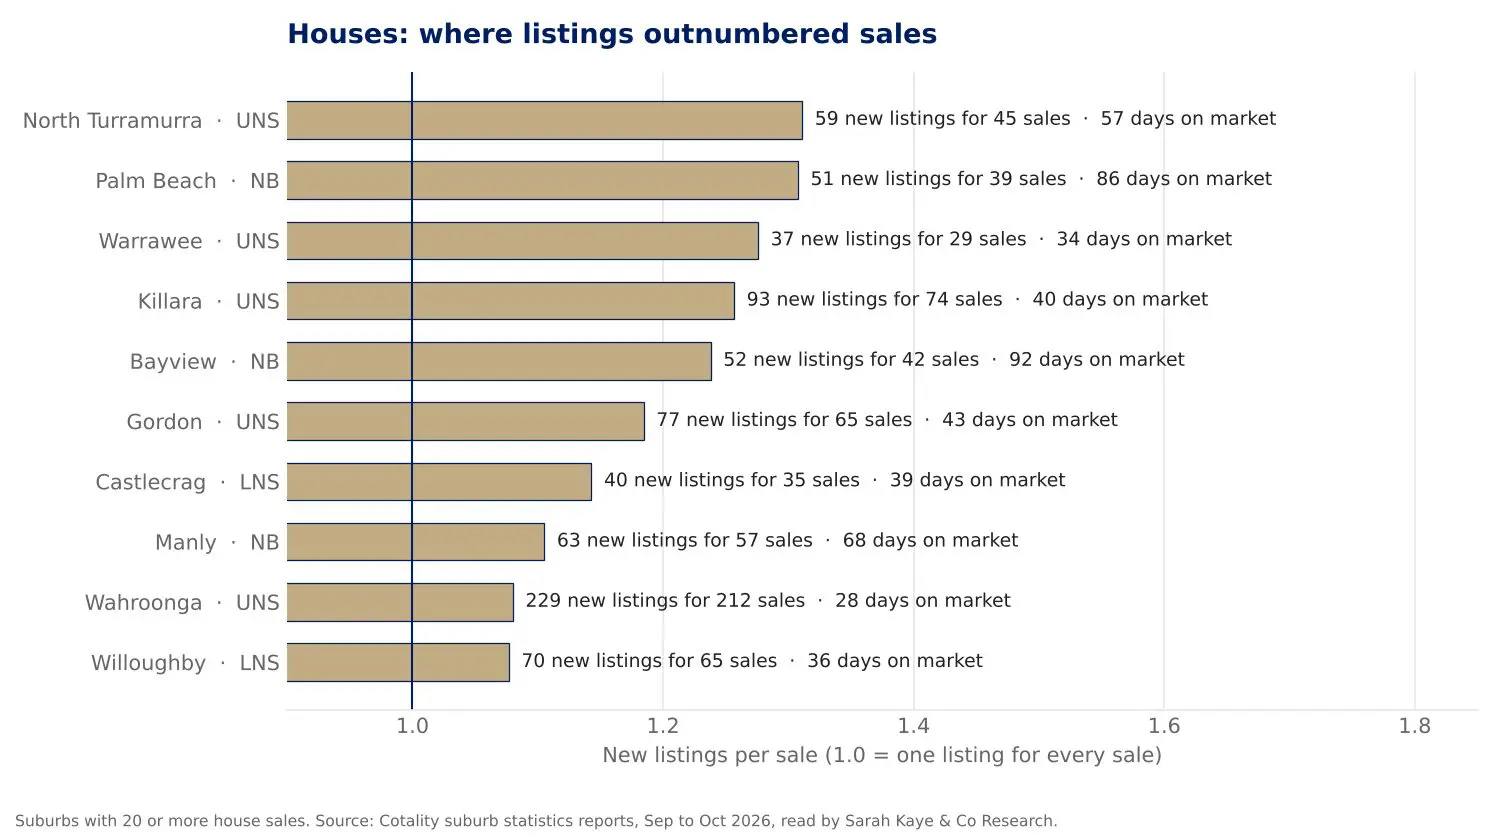
Suburbs where new house listings outnumbered house sales over 12 months, with median days on market. Cotality suburb statistics reports.
The suburbs where listings outnumbered sales include Palm Beach, Manly, Castlecrag, Balgowlah Heights and Collaroy on the Beaches, and Killara, Gordon, Warrawee and North Turramurra on the Upper North Shore. Palm Beach houses took a median of 86 days to sell, Bayview 92.
This matters because the common belief is that the most expensive homes change hands quietly between people who know each other. Some do. But in the past year, the top-end suburbs in our area had more homes advertised than sold. If you are buying at that level, there is more on the market than it looks, and time is on your side.
Speed and silence go together
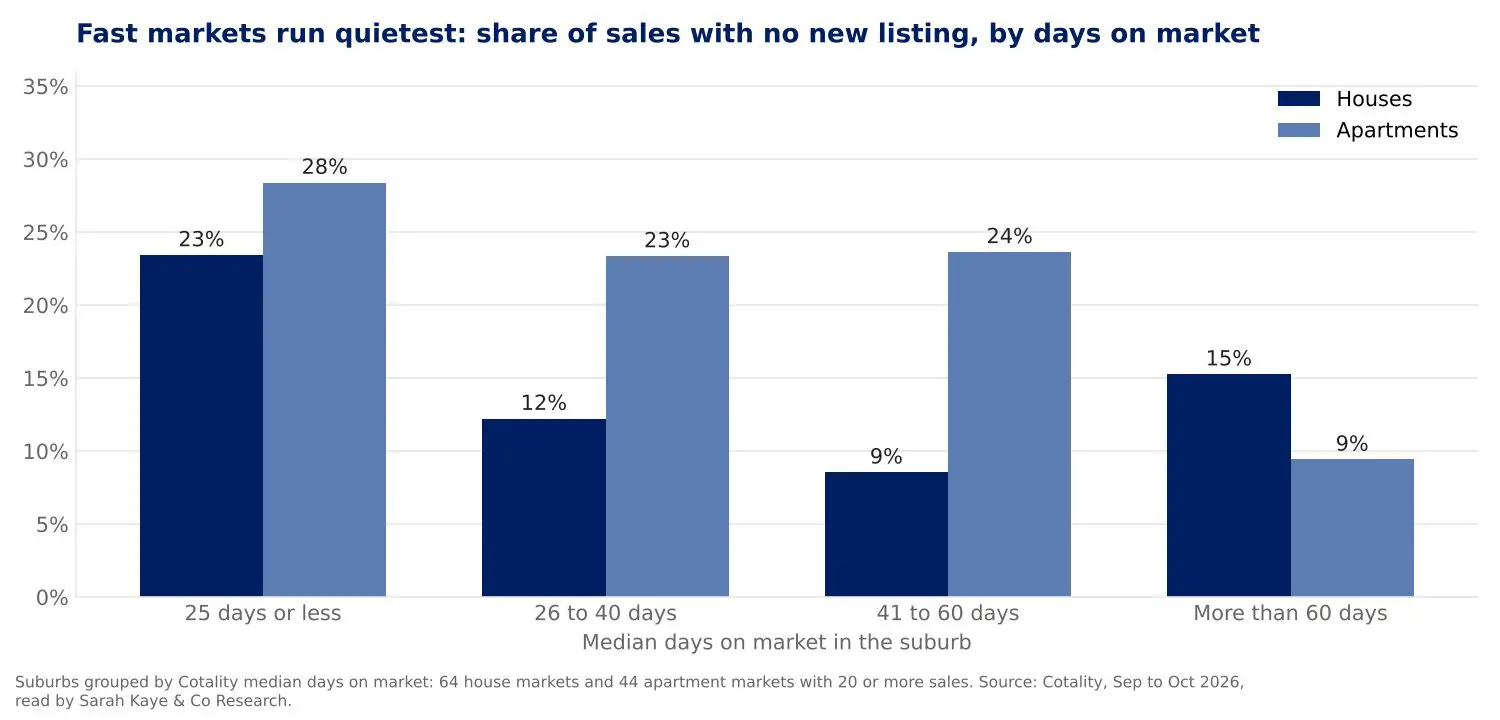
Minimum share of sales with no new listing, suburbs grouped by median days on market. Cotality suburb statistics reports.
Grouping suburbs by how fast homes sell tells the same story from another angle. In suburbs where the median home sells in 25 days or less, about 23 per cent of house sales and 28 per cent of apartment sales had no new listing. Where homes take more than 60 days, the house figure is lower and the apartment figure drops to under 10 per cent.
Quiet sales are a symptom of demand outrunning supply. When an agent has three ready buyers for every home, the campaign is optional. When they have none, every home goes online.
Has it changed over the past year?
We do not know yet, and we would rather say that than guess. These reports are a single snapshot. The Valuer General's register shows sales volumes across the 76 suburbs were steady year on year to March 2026 (house sales from July to March were about two per cent higher than the year before). The register thins out after April because sales are recorded at settlement, not exchange, so the recent months are incomplete, not necessarily slow. We refresh these reports every quarter, and from the next refresh we will be able to say whether the quiet share is rising or falling.
What we can say is that the published national benchmarks sit in the same range. REBAA puts the national share of off-market sales at up to 20 per cent. One Sydney listings service reported more than one in five Sydney sales in the past year without an online listing. Our floor of 23 per cent for apartments and 12 per cent for houses is consistent with both, and it is the first time the figure has been cut suburb by suburb for Sydney's north.
What it means if you are buying
Know which market you are in. In the quiet pockets, access matters and the visible listings understate what is trading. At the top end and on the Upper North Shore, access matters less than patience and a clear view of value.
A quiet sale is not automatically a bargain. PropTrack's research found that off-market houses in Sydney sold for about four per cent less than listed homes in 2022. That is a vendor's loss, and sometimes a buyer's gain, but it is an average across every kind of quiet sale, including the ones sold in a hurry. The homes we see change hands quietly in Curl Curl or Cammeray are rarely cheap. They are simply never contested.
Evidence beats access. Whether a home is listed or not, the question is the same: what have comparable homes actually sold for, and what is wrong with this one that the listing does not say? Over 75 per cent of the homes we secure never reach the portals, and every one of them is bought on the same sales evidence we would use at auction. We wrote last year about how off-market property actually works on the Northern Beaches; these figures are the first time we have been able to put a number on it.
If you are buying on the Northern Beaches or the North Shore and want to know how your suburb reads, we are happy to talk it through on a free 30-minute call with both directors. As a Northern Beaches buyers agent working across all three regions, we will tell you honestly whether your target suburb is one where access matters or one where patience does.
Method notes. Source: Cotality suburb statistics reports for 76 suburbs, prepared 24 September to 13 October 2026, read by Sarah Kaye & Co Research; sales counts cross-checked against the NSW Valuer General's register (arm's-length residential sales by contract date). "Properties sold" and "new sale listings" are Cotality's 12-month counts for houses and units; the quiet share is sales minus new listings over sales, floored at zero. Suburb figures are shown only where there were 20 or more sales. Cotality's sold counts run to June 2026 and its listing counts to the report date, so the windows are offset by about a quarter; the "total properties listed" test, which includes stock carried in from the prior year, narrows the gaps but preserves the regional pattern. Benchmarks: REBAA (national, up to 20 per cent); PropTrack Off-Market Sales Performance Report, July 2023 (2022 data, off-market defined as sales not matched to a realestate.com.au listing; Sydney houses 4.3 per cent lower, Sydney units 2.8 per cent lower).
By Mike Kaye, Co-founder and Director, Sarah Kaye & Co. Buyers Agents. Sarah Kaye & Co Research, October 2026.