
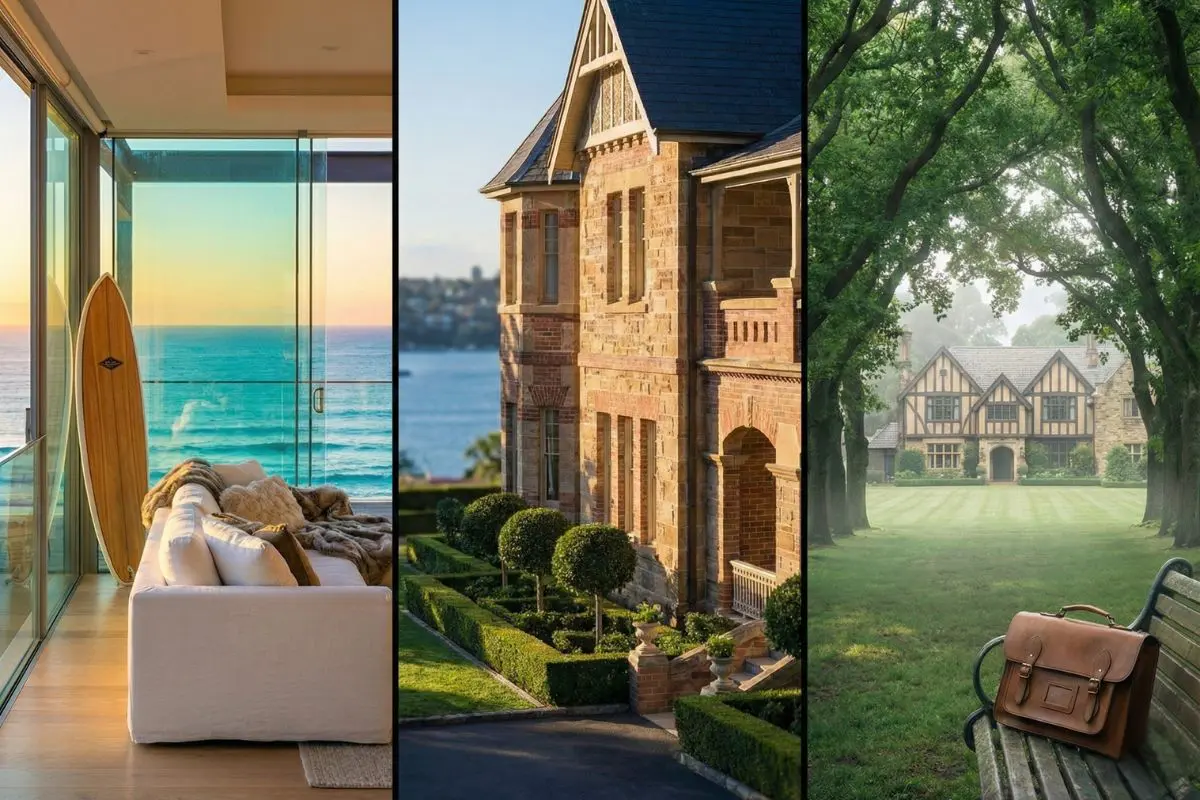
Three capitals, ten years
Manly, Mosman and Wahroonga — what a decade of NSW Valuer General data says about the three suburbs at the heart of our patch.
A Sarah Kaye & Co Research piece — ten years of NSW Valuer General registered settlements across three suburbs that broadly stand for the three regions we cover.
Executive summary
Across the past decade, Wahroonga and Manly houses have broadly doubled in value, while Mosman houses have grown more slowly. For apartments, the ranking reverses: Mosman and Wahroonga have grown 70–78% across the period, Manly just 29%. The same pattern holds in both property types — the most prestigious postcode in our patch hasn’t been the highest-growth one. Wahroonga has consistently been the calmest market and the most resilient through each correction in the past ten years.
We track these three suburbs side by side because reading any one of them in isolation yields a thinner answer than reading them together. For buyers across Sydney’s Northern Suburbs, the right answer depends on which question matters most: peak growth, lowest volatility, or current price level. The three markets answer those three questions differently — and for a buyer making a decision today, the macro conditions of 2026 sharpen rather than blur which question matters.
For the past several months we’ve been working through ten years of property transactions across Sydney’s Northern Suburbs. The most useful exercise has been the one we’ve just completed: taking three suburbs that broadly stand for the three sub-regions we work in — Manly for the Northern Beaches, Mosman for the Lower North Shore, Wahroonga for the Upper North Shore — and reading their decades side by side.
We pulled every arms-length residential sale recorded by the NSW Valuer General between April 2016 and March 2026. The headline is worth pausing on, and the longer you look, the more interesting it gets. The three suburbs tell three quite different stories. And the story changes again when you separate houses from apartments.
Houses: three lines, three rhythms
The chart below shows the 12-month rolling median house price for each suburb across the decade. The smoothed line is essential because the underlying monthly figures bounce around — particularly Manly, where only 55–80 detached houses change hands each year.
Figure 1. Median house price (12-month rolling) — Wahroonga, Mosman, Manly. Source: NSW Valuer General; Sarah Kaye & Co Research.
Three observations stand out. First, the 2017–2019 correction. Sydney’s prestige markets pulled back through the lending-tightening cycle of the late 2010s. Mosman fell from a $4.0m annual median in 2017 to $3.55m by 2019, a 12% trough. Manly slipped from $3.34m to $3.00m. Wahroonga, smaller in absolute terms, fell from $2.20m to $1.86m — a 15% pullback. None of the three escaped, and all three reached their trough within twelve months of each other.
Second, the 2020–2021 surge. Each market accelerated through the COVID rebound, but at very different speeds. Manly’s annual median jumped from $3.09m in 2020 to $4.63m in 2021 — a 50% leap. Mosman climbed 23% in the same window. Wahroonga 25%. Manly’s leap is partly real and partly an artefact of small sample size, but even with that allowance the suburb grew materially faster than the other two. The pandemic-era shift toward space, light and outdoor amenity rewarded the Northern Beaches more sharply than the harbour-front or the leafy upper north.
Third, the 2022 reset. Both Mosman (-9%) and Manly (-11%) gave back ground in the rate-hike cycle. Wahroonga didn’t — its 2022 annual median ticked slightly higher than 2021. Across the full decade, Wahroonga is the calmest of the three: its year-on-year changes ranged from -15% to +25%, with a standard deviation of 12 percentage points. Manly’s ranged from -11% to +50%, with a standard deviation of 18. For buyers focused on resilience rather than peak growth, Wahroonga has been the most predictable house market of the three.
CoreLogic’s hedonic-adjusted average annual capital growth — a more defensible long-run figure than simple median ratios, because it controls for the mix of properties sold — places Wahroonga houses at 8.1% per annum, Manly at 8.8%, and Mosman at 5.8%. Compounded over the decade, those rates produce roughly +118%, +131% and +76% respectively. Manly and Wahroonga have broadly doubled in capital terms. Mosman has grown materially, but more slowly. The most prestigious postcode of the three has been the slowest grower for houses. (The land-share economics behind that pattern are covered in our companion piece on the Sydney’s Northern Suburbs cost to build.)
Apartments: the order flips
Move from houses to apartments and the ranking changes character.
Figure 2. Median unit price (12-month rolling) — Wahroonga, Mosman, Manly. Source: NSW Valuer General; Sarah Kaye & Co Research.
Mosman and Wahroonga apartment markets have grown at very similar long-run rates — 5.9% per annum and 5.5% per annum respectively, on CoreLogic’s hedonic measure. The Manly apartment market, despite being the most expensive of the three at both ends of the decade, has been the slowest grower: 2.6% per annum on the same measure, compounding to roughly +29% over the ten years.
Why has Manly apartment growth lagged? In short, the median is being weighed down by older 1960s–80s walk-up stock that bears most of the median volume. Newer top-end developments lift the leading edge of the market but don’t move the median in the way that a single suburb-wide growth rate suggests. Mosman’s apartment stock has a similar age profile, but is more closely tied to the harbour-front demand that has held its value better through cycles.
The 12-month rolling median tells a tidier version of the same story. Wahroonga apartments climbed steadily from an $830,000 12-month rolling median in early 2017 to $1.16m by March 2026. Mosman climbed from $1.13m to $1.33m. Manly’s rolling line rises more sharply through the COVID period — peaking near $2.0m through 2022 — then sits broadly sideways for the next three years.
Convergence and divergence
Look across the decade and a clear pattern emerges. For houses, the absolute gap between the three suburbs has widened. In 2016, Mosman’s annual median sat $1.69m above Wahroonga’s. By 2025 the gap was $2.72m. In ratio terms, however, the relationship is almost unchanged — Wahroonga’s 2025 median is 52% of Mosman’s, identical to where it sat in 2016. The three house markets have moved together more often than they’ve moved apart, even when the year-on-year reads differ.
Apartments show the opposite. The Wahroonga apartment market has been quietly converging with Mosman over the decade. The gap between their 12-month rolling medians has narrowed from around $300,000 in 2017 to under $200,000 today. Manly has pulled away from both: the most expensive apartment market of the three throughout the period, but increasingly an outlier in absolute price rather than in growth rate. The decade has loosened the old North-Shore-versus-Northern-Beaches apartment-price hierarchy in places, and reinforced it in others.
The 2023–25 normalisation period is also worth a brief read. After the 2022 correction, Mosman houses recovered hard — climbing 11% in 2023 and another 11% in 2024 before settling slightly lower in 2025. Manly houses rose more gently, 7% in 2023 and 6% in 2024, then 8% in 2025. Wahroonga houses crept up at a steady 2–6% per year. In other words, the most expensive market has run the most volatile recovery, while the most affordable of the three has continued its steady accretion. Apartments have been quieter across the same window — Mosman edged up gradually, Manly was broadly flat, Wahroonga ticked higher.
Volatility and resilience, side by side
Comparing year-on-year movements rather than long-run totals shows the texture clearly. For houses, the standard deviation of annual percentage changes between 2017 and 2025 comes to 12.0 for Wahroonga, 13.2 for Mosman, and 17.6 for Manly. For apartments, the same measure produces 9.9, 10.4 and 11.9 — same ordering, more compressed range. Wahroonga is the steadier market in both property types. Manly is the most volatile in both. Mosman sits in the middle.
The simplest read: Manly’s smaller turnover, particularly for houses, amplifies year-to-year noise. The same suburb’s beach-lifestyle premium attracts surges in confident markets and pullbacks in cautious ones. Wahroonga’s deeper family-home buyer base supports steadier underlying demand. Mosman is anchored by harbour-front demand that has been broadly stable through cycles. The lifestyle premium and the family premium pay off differently across the cycle.
A note on sample sizes
Two figures in this piece deserve a careful read. Manly’s +50% annual house median in 2021 is built on 80 sales. That is enough to be a meaningful signal — but not enough to be precise. The CoreLogic hedonic figure, which adjusts for the mix of houses sold, suggests Manly’s true 2021 growth was strong but probably closer to +30%. We’ve quoted the simple median figure because it is what the data says, and we’d treat the +50% as indicative rather than exact.
Manly’s 2023 apartment median (-18%) is built on 276 sales — a robust sample, and a real signal. Wahroonga’s 2023 apartment median (also -18%) is built on 106 sales — robust enough to be meaningful, but noisier than the larger Mosman and Manly samples. As a general rule, we treat annual medians on samples above ~50 transactions as meaningful for residential markets. Rolling 12-month medians built on 100 or more sales are more robust again. Single-month figures should be read as a journey, not a destination — particularly in thinner markets such as Manly houses or Wahroonga units.
What this means for buyers
Three things follow from the analysis. The most expensive suburb has not been the highest-growth suburb in either property type. For houses, Mosman started highest and grew the slowest. For apartments, Manly started highest and grew the slowest. Capital growth is a separate question from price level, and the two routinely deliver different answers across these three markets.
The strongest house-growth suburbs of the three — Manly at roughly +131% and Wahroonga at roughly +118% — are quite different propositions. Beachside lifestyle on the one hand, family upper-North-Shore on the other. They’ve grown at similar long-run rates by quite different mechanisms. The strongest apartment-growth suburb (Mosman) shares more with Wahroonga’s apartment market than with its own house market.
Resilience matters as much as growth in a property purchase. Wahroonga held up best through the 2017–19 correction, didn’t fall in 2022 when the other two suburbs did, and has continued to grind higher through 2024–25. Manly’s headline growth came with the largest swings in both directions. Mosman has been steady but unspectacular.
We track these three suburbs side by side because reading any one of them in isolation produces a thinner answer than reading them against each other. Buyers across our patch — the Northern Beaches, the Lower North Shore, and the Upper North Shore — are routinely choosing between markets like these, and the right answer depends on whether they care more about peak growth, lowest volatility, or current price level.
What this means for buyers now
Three sets of conditions are weighing on buyers as we move through mid-2026: a sustained higher interest rate environment, real cost-of-living pressure on household budgets, and a layer of geopolitical and policy uncertainty — including a recent change to investor taxation that may or may not change behaviour in the months ahead. None of those conditions are unique to our patch, and none of them change the fundamentals of the three suburbs in this piece. But they do change which questions a buyer should be asking.
First read — a quieter market overall
The first read of the data is that buying conditions are quieter than they were two years ago. Mosman houses pulled back 5% in 2025 after two strong years. Wahroonga is grinding higher at modest single digits. Manly has been firmer, but its underlying volatility is the highest of the three. Apartments across all three suburbs have been quieter still. For a buyer with a five-to-ten-year horizon, a softer market is generally a more thoughtful time to buy — fewer competing bidders, more leverage to negotiate, more time to do proper due diligence on each property. That has been our experience in the past quarter on the ground. (Our autumn 2026 Sydney’s Northern Suburbs price tracker covers the most recent settlement windows in more detail.)
Second read — three suburbs, three different answers
The second read is that the macro factors don’t argue for the same response across the three suburbs. Manly, being the most volatile, will likely move more in either direction if conditions shift further; that suits buyers who can hold through cycles, less so those needing certainty over a shorter horizon. Wahroonga has been the calmest in every correction in the past decade — a pattern that’s relevant if confidence wobbles further. Mosman has been the most expensive but the slowest-growing for houses; the question for buyers there is whether they’re paying for the current price level or for future growth. The two answers are different, and the answer that suits each buyer depends on their horizon and their tolerance for the cycle.
Third read — apartments and the tax change
The third read concerns the apartment market specifically. If the recent tax change does prompt some investor exits — and we don’t yet know whether it will, or by how much — the most likely effect will be on the volume of competition in apartment markets rather than on long-run prices. That works in an owner-occupier’s favour. It’s also worth noting that Manly’s apartment median has been broadly sideways for three years already. A buyer entering that market today would be acquiring at a level the market has tested for some time, which is not the same as buying at a peak.
The risks are real, and we owe clients an honest read of them. A confidence shock or a sharper rate environment from here could deepen the recent softening, particularly in the apartment markets that depend on investor participation. Thin markets — Manly houses, Wahroonga apartments — will continue to move more on small changes in sentiment than the data alone would predict. We would be wary of any buyer who feels rushed in this environment. The next four months are unlikely to look so dramatically different from the last four that a hurried decision is warranted. The discipline of saying no to properties that don’t fit on the data, the due diligence, or the price is more important now than at any other point in the recent cycle.
For clients coming to us in the next quarter, the practical framing is this. The market rewards patience over urgency, evidence over instinct, and a clear-eyed view of which question matters most to you — capital growth, price level, or resilience to the next correction. The three suburbs in this piece each answer those three questions differently.
We’ll refresh this view annually. The next ten-year comparison will follow in early 2027, when the next full year of NSW Valuer General registered settlements is complete.
About the author
Mike Kaye is Co-Founder and Director of Sarah Kaye & Co., a boutique, director-led buyers agency working across Sydney’s Northern Suburbs — the Northern Beaches, the Lower North Shore, and the Upper North Shore. Mike leads Sarah Kaye & Co Research, the firm’s in-house analytics practice. A former Accenture Global Partner and Australian Army Officer, he studied property law, valuation, and economics at UNSW and is a Graduate of the Australian Institute of Company Directors. He has had articles profiled in the Australian Financial Review, the Sydney Morning Herald, and AICD Magazine. As a Northern Beaches buyers agent, Mike works exclusively for buyers — fixed-fee, no kickbacks, with over 75% of clients’ homes secured off-market.