
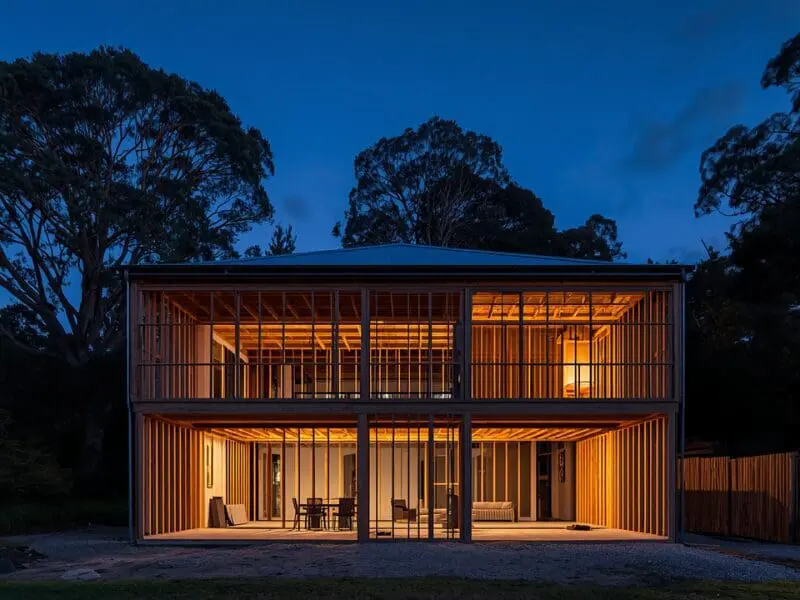
The cost to build – Northern Beaches | Upper North Shore | Lower North Shore
Three channels, three regions — how construction costs reach house and apartment prices across Sydney’s Northern Suburbs.
A Sarah Kaye & Co Research note on how construction-cost data reaches house and apartment prices in our patch.
Executive summary
Construction costs have moved from being the dominant story in Australian residential property to a more nuanced one. Cost growth nationally has slowed sharply from its 2021–22 peaks and now sits at multi-year lows, but levels remain well above the pre-pandemic base. New apartment approvals across the country fell 26 per cent in March 2026 — a clear signal that development feasibility is still tight.
For buyers across Sydney’s Northern Suburbs the relevance of those numbers depends heavily on where they are looking. Construction cost reaches the market through three distinct channels — build-new, knock-down-rebuild feasibility, and new-apartment supply — and each of the three regions in our patch weights those channels differently. Land share is the determining factor. Where land dominates (Mosman, Manly), construction moves the market more slowly. Where construction is a larger share (Wahroonga and the wider Upper North Shore), cost movements bite faster.
The cost of building a residential dwelling in Australia has been the loudest single story in the property market for the past four years. From the second half of 2020, materials, labour and contractor margins moved sharply higher, peaking through 2022. Since then the rate of cost growth has eased, but the underlying levels remain well above their pre-pandemic base, and the consequences are still working through buyers, builders and developers.
For buyers across Sydney’s Northern Suburbs — the Northern Beaches, the Lower North Shore, and the Upper North Shore — the practical question is more specific. How does what is happening on construction sites actually reach the price someone pays for a house in Wahroonga, or an apartment in Mosman, or a beachside unit in Manly? The answer is rarely direct. But it does reach those markets, through three identifiable channels.
Where we sit on construction costs now
The Cordell Construction Cost Index, published quarterly by Cotality, is the canonical Australian construction cost measure. The Q4 2025 release reported nationwide costs rising about 1 per cent in the quarter — the strongest single quarter of the year — with annual cost growth at multi-year lows. The ABS Producer Price Index for input prices to house construction tells a similar story: prices rose 0.6 per cent in the March 2026 quarter and 3.2 per cent through-the-year, with labour the principal driver. Industry forecasts from Rider Bucknall, Altus Group and others put 2026 cost growth around 4 per cent nationally, with Sydney broadly in line.
The story is not that costs are falling — they are not. Costs are still rising, but they are rising at a pace closer to long-run inflation than to the double-digit pace of 2021–22. Levels, meanwhile, remain materially above where they were pre-pandemic. The ABS estimates the time required to complete a typical new dwelling has lengthened by around 40 per cent since pre-pandemic — a measure of the labour and supply-chain capacity that has not fully returned.
The most telling indicator for new supply is the ABS Building Approvals series. Total dwelling approvals nationally fell 10.5 per cent in March 2026. Within that total, approvals for private-sector dwellings excluding houses — predominantly apartments — fell 26 per cent. That is a clear feasibility signal: developers are pulling back rather than lining up the next cycle of supply.
The three-channel build-cost framework
We think about construction-cost transmission through what we call the three-channel build-cost framework — build-new, knock-down-rebuild, and new-apartment-supply. The framework matters because each channel reaches each of our three regions differently, and aggregating them obscures more than it reveals.
The first is the build-new channel. When someone is choosing between buying an existing house and building a new one on vacant or near-vacant land, construction cost is half the calculation. As costs rise, existing homes become relatively more attractive, supporting their prices. As costs ease, the calculation tilts back.
The second is the knock-down-rebuild channel. In suburbs where older housing stock sits on valuable land, buyers regularly consider whether to renovate, replace, or buy elsewhere. Higher construction cost widens the gap between the value of the underlying land and the value of the finished improved property. It can deter rebuilds (suppressing the new-house premium) or encourage owners to extend rather than replace.
The third is the new-apartment-supply channel. Apartment development is feasibility-driven. Developers will only commit if the expected sale price covers construction cost, land, planning, financing, marketing, and a margin. When costs rise faster than market prices, projects stop. When supply stops, market prices for existing apartments are insulated from new competition. The March 2026 approvals data is what this channel looks like in real time.
These three channels affect each of our three regions differently, because the underlying composition of the housing stock and the planning settings differ in each.
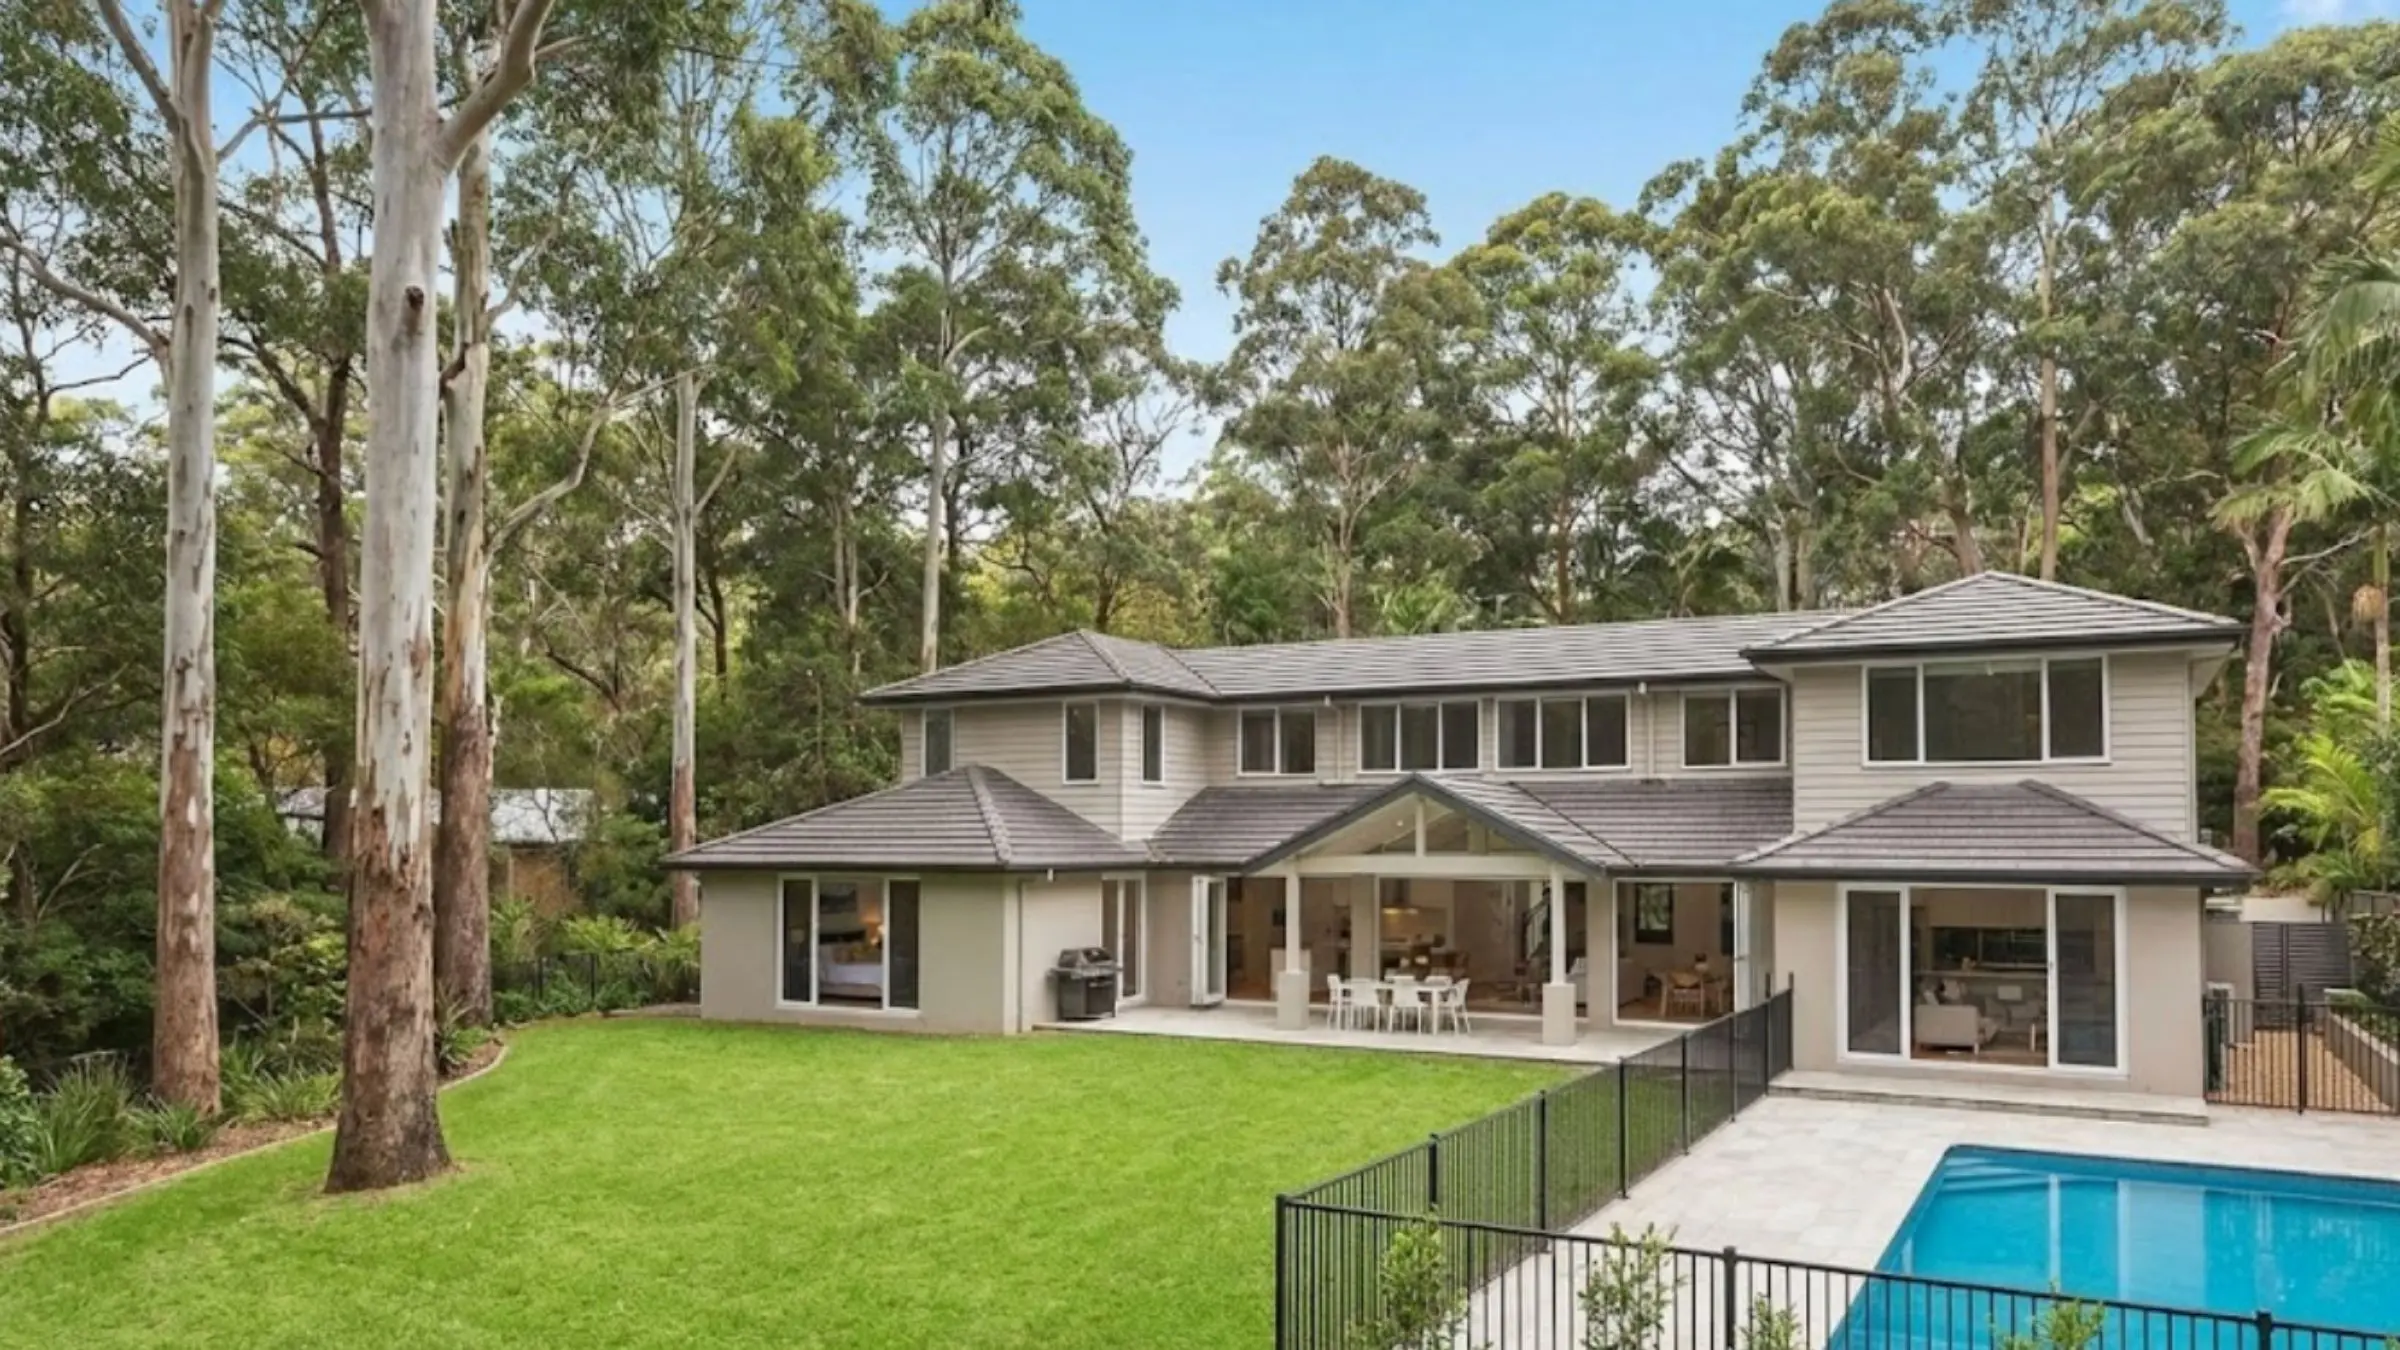
Upper North Shore: where build costs matter most
Of the three regions, the Upper North Shore is where construction costs reach property prices most directly. Wahroonga, Pymble, Killara and the broader Ku-ring-gai corridor are built on traditional quarter-acre family blocks, with houses that often pre-date the 1970s sitting on land that supports redevelopment. The build-new and knock-down-rebuild channels both run actively here. A buyer choosing between an unrenovated 1960s house, an extended one, and a recent custom build is effectively pricing the cost-to-build into their offer every time.
Wahroonga’s median house land area is around 940 square metres — materially larger than Mosman’s (around 520) and Manly’s (around 260). The construction component of a typical Upper North Shore property value is therefore higher in absolute and proportional terms. Planning reforms around station precincts have also opened parts of the Upper North Shore to higher-density development, meaning the apartment-supply channel is more active here than further south.
The practical implication is that easing construction cost growth, even at the current modest pace, is more meaningful to Upper North Shore prices over the medium term than to the other two regions. The steady grind-higher pattern in Wahroonga house prices through 2023–25 has been consistent with build-cost moderation rather than market exuberance.
Lower North Shore: where land share dominates
In Mosman, Cremorne, Neutral Bay and the harbour-facing side of the Lower North Shore, land share dominates the value equation. Harbour proximity, view, and the scarcity of suitable freestanding sites mean land typically accounts for the larger share of a property’s price. By our estimate — drawing from typical Sydney premium-house build rates and median sale prices — land share for a median Mosman house sits in the 70–80 per cent range. That is substantially higher than the Upper North Shore.
That has two implications. The build-new and knock-down-rebuild channels exist here, but they operate against a smaller base. A 5 per cent rise in construction cost moves the replacement-cost benchmark, but on a property where construction is a quarter of total value, the headline effect on price is muted. The apartment-supply channel is largely blocked by planning constraints — character provisions, heritage controls and the practical scarcity of redevelopable sites mean Lower North Shore apartment supply is essentially static. New competition rarely arrives.
This is part of why the Mosman apartment market has been the steady grower it has been (around 5.9 per cent per annum on CoreLogic’s hedonic measure over the decade). It is also part of why Mosman houses have grown more slowly than the other two regions in headline terms — the high starting price level and the high land share leave less room for capital-growth multipliers than the Upper North Shore offers.
Northern Beaches: feasibility-constrained
The Northern Beaches sits between the two. Manly, Freshwater, Balgowlah and the beach-front strip share the high-land-share characteristic of Mosman; the inland and northern parts of the region — Brookvale, Dee Why, Frenchs Forest — have seen more apartment activity in the past decade and are more sensitive to feasibility settings.
Manly’s apartment median has been broadly sideways for three years, which is at least partly a supply story. Construction costs at 2024–26 levels make new beachside apartment development feasibility marginal, and planning constraints further compress what could otherwise be a more active pipeline. The freestanding-house market is land-dominant, similar to Mosman; the apartment market is supply-constrained without near-term relief.
If apartment construction costs ease further from here, or if planning reforms broaden the buildable envelope, the Northern Beaches apartment market is the one most likely to be re-priced — both up (if new supply lifts comparable values) and down (if new supply competes with existing stock). Buyers entering the Manly apartment market today are entering a market that has tested current levels for some time.
What this means for buyers
The most useful question construction-cost data prompts for a buyer is not “what will prices do?” — it is “what is the cost-to-build floor under what I am being asked to pay?” In our patch, that floor is most relevant for Upper North Shore buyers considering renovation versus replacement, and for owner-occupiers comparing established apartments against new releases.
Two practical observations follow. New-apartment supply is weak across all three regions and likely to stay weak through 2026 and into 2027. That works in the favour of owner-occupiers buying established stock: less competition from new releases, and current apartment prices that are not being undercut by feasibility-justified new product. For buyers considering renovation versus knock-down-rebuild, especially on the Upper North Shore, the slowing of construction cost growth makes substantial works marginally more workable than they have been since 2020 — but levels are still high, and the labour squeeze on completion times is real. A project commenced today is likely to take meaningfully longer than the equivalent project would have in 2019.
Construction costs are a slow-moving force on residential markets. They do not drive month-by-month volatility, but over time they set the floor for what the next generation of housing supply will cost — and indirectly, the price level at which existing stock trades. The current period of moderation looks more like a return to trend than a reversal of the past five years’ levels.
Patient, evidence-led decisions in this environment compound better than rushed ones.
We’ll refresh the Sydney’s Northern Suburbs cost-to-build benchmark when the next Cordell quarterly release lands and when the ABS publishes the June 2026 building-approvals data.
— — —
About the author
Mike Kaye is Co-Founder and Director of Sarah Kaye & Co., a boutique, director-led buyers agency working across Sydney’s Northern Suburbs — the Northern Beaches, the Lower North Shore, and the Upper North Shore. Mike leads Sarah Kaye & Co Research, the firm’s in-house analytics practice. A former Accenture Global Partner and Australian Army Officer, he studied property law, valuation, and economics at UNSW and is a Graduate of the Australian Institute of Company Directors. He has had articles profiled in the Australian Financial Review, the Sydney Morning Herald, and AICD Magazine. As a Northern Beaches buyers agent Mike works exclusively for buyers — fixed-fee, no kickbacks, with over 75% of clients’ homes secured off-market.