
Sarah Kaye & Co Research
Before calling spring, we looked hard at winter. Across the Upper North Shore, the Lower North Shore and the Northern Beaches, here is what held true everywhere, where the three districts part ways, and what spring now has to show.
We wanted to know where spring will take the market in Sydney’s Northern Suburbs. The honest place to start was behind us. Winter sets the course for spring, whether we like it or not. The sellers who took a loss in July are the owners deciding now whether to list. The buyers who stayed home are deciding whether to come back. So before saying anything about spring, we went back through winter. We did it in each of our three districts: the Upper North Shore, the Lower North Shore and the Northern Beaches.
We used the register: the NSW Valuer General’s record of every settled sale in the state. It runs a few weeks behind the market. But it is the truth of what changed hands, and for how much. We added Cotality’s suburb reports, which many readers will know as RP Data, for detail. This article pulls the three district reports together. It sets out what held true everywhere, where the districts part ways, and what spring has to show. The detail for each district sits in its own report, linked below.
Why we started with winter
Spring data is still thin. A sale only reaches the register once it has settled. That is usually six weeks or more after contracts are signed. Homes that sold in early September barely show yet. The first proper reading will arrive with the late October updates. By then spring is half over. So the best guide to the rest of spring, and the run into Christmas, is the season just gone. Who sold, what did they make, and who is now in a position to sell?
The test we used is simple. Take every home that sold this winter and had also sold between eighteen months and five years earlier. Compare the two prices for the same home. Drop flips, rebuilds and anything that was not an ordinary sale between strangers. What is left is the cleanest price test the register can give.
What held true across all three districts
Five things were the same everywhere. First, winter’s sellers made almost nothing. A year ago the typical seller made 10 to 13 per cent on what they had paid. This winter it was 1.5 to 3 per cent. Between a third and two in five sold at a loss.
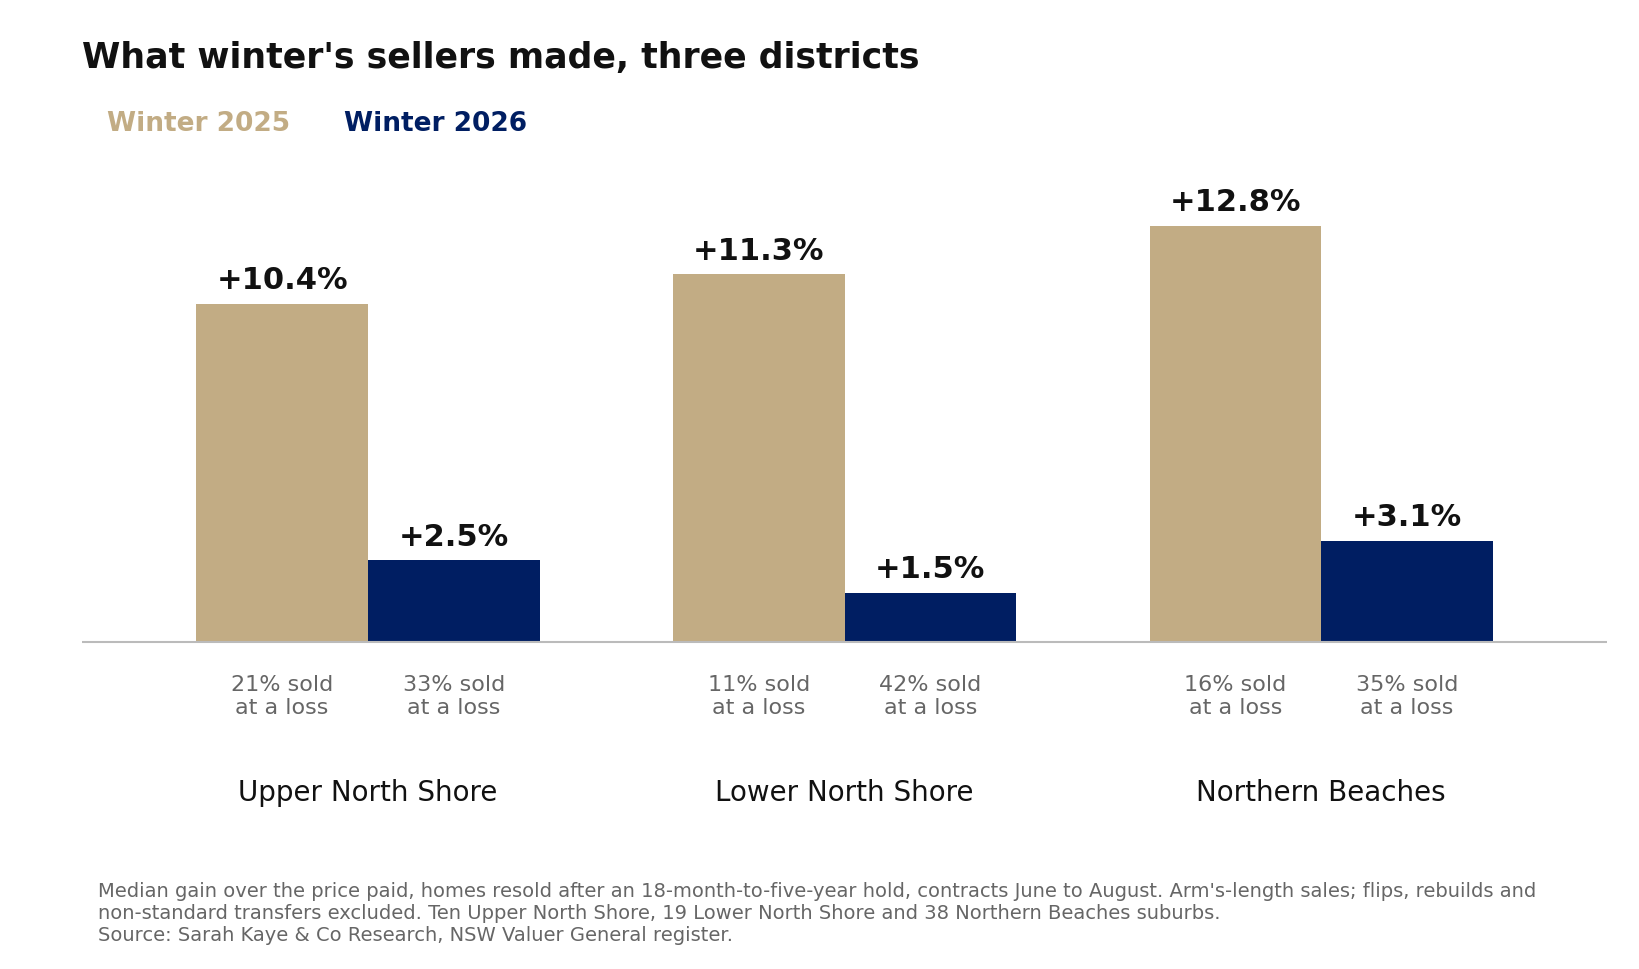
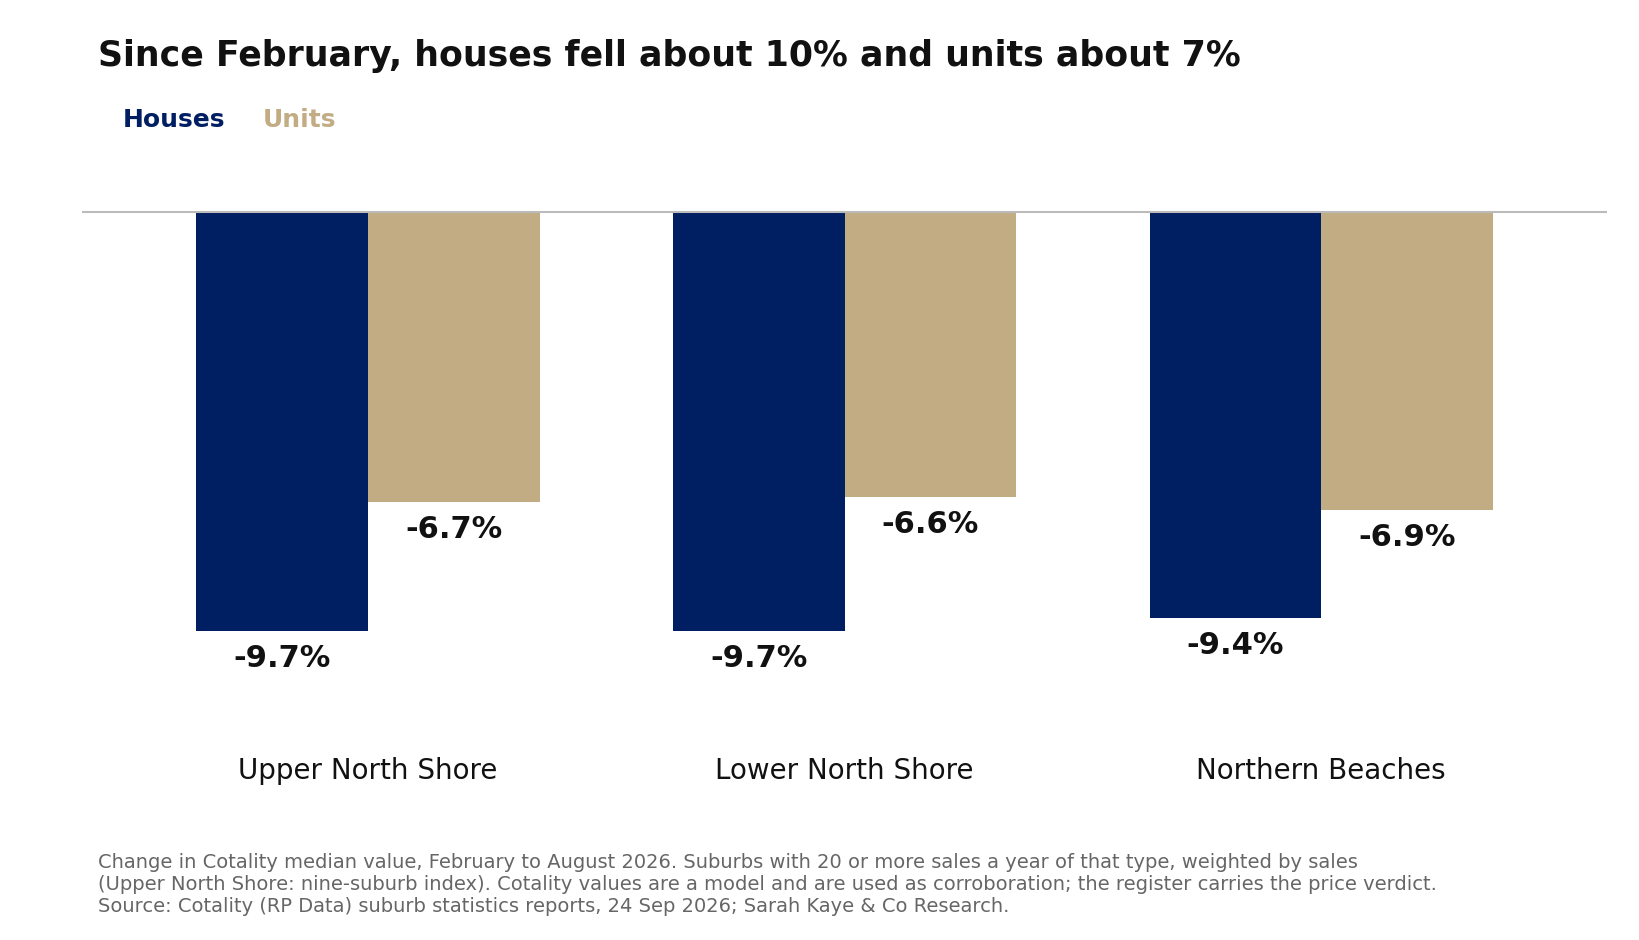
Second, the turn came at the same time. In all three districts, gains held up to March. They fell away between April and June, after the first two rate rises and the May Budget. Third, Cotality’s values fell by about the same amount from February in every district. Houses fell close to 10 per cent and units about 7 per cent. Fourth, fewer homes sold in every district, because fewer owners chose to sell into a falling market. And fifth, the people who can sell still can. Owners who bought in 2021, 2022 or 2023 mostly came out ahead. The owners most exposed are those who bought in 2024.
For perspective, house values in all three districts are still well above August 2020. They are up 14 to 41 per cent on the North Shore and 26 to 70 per cent on the Beaches. The mechanism is the same too. People can only pay what they can borrow. Three rate rises this year hit the family with the big mortgage first.
Where the three districts part ways
The differences matter more than the headline, because they decide what you should do.
Where the squeeze sits. On the Upper North Shore and the Beaches, the pain is in the family band, from $2.5 million to $4 million. That is where gains vanished and sales fell furthest, while homes below and above held up better. On the Lower North Shore the pressure starts lower, from about $1.5 million. It sits on the harbour, where Mosman, Neutral Bay and Cammeray fell furthest.
The top end. On the Upper North Shore and around Manly, the dearest suburbs held. On the Lower North Shore the dearest fell most, and sales above $10 million are well down on recent years. The two ends of the Beaches differ too. Our buyers struggle to find stock in Manly, while Palm Beach has more for sale than buyers.
Timing and volume. The Lower North Shore turned first, with house values easing from last September. It also traded thinnest, with winter sales down 28 per cent. The Northern Beaches turned last and traded best, down 10 per cent. But its resale gains were still falling in July and August. The Upper North Shore sat between, down 18 per cent.
Houses and flats. On the Lower North Shore and the Beaches, flats held up better than houses. On the Upper North Shore the two fell together.
Three districts side by side, winter 2026
| Measure | Upper North Shore | Lower North Shore | Northern Beaches |
|---|---|---|---|
| Winter sellers’ typical gain, 2025 to 2026 | +10.4% to +2.5% | +11.3% to +1.5% | +12.8% to +3.1% |
| Winter 2026 sellers at a loss | 33% | 42% | 35% |
| Winter sales against a normal winter | 18% fewer | 28% fewer | 10% fewer |
| House values, Feb to Aug 2026 (Cotality) | −9.7% | −9.7% | −9.4% |
| Unit values, Feb to Aug 2026 (Cotality) | −6.7% | −6.6% | −6.9% |
| Where the squeeze sits | $2.5m to $4m | From $1.5m, and on the harbour | $2.5m to $4m |
| Dearest suburbs | Fell least | Fell most | Held (Manly end) |
| Flats against houses | Fell together | Flats held better | Flats held better |
| Spring’s test: beat winter’s mark of | +2.5% | +1.5% | +3.1% |
Register figures: arm’s-length sales, $400,000 and above, resale pairs held 18 months to five years; winter is contracts 1 June to 31 August; sales counts are lag-matched (settled by 3 September) against the 2024 and 2025 average. Cotality values are model estimates used as corroboration. Suburb sets: ten on the Upper North Shore, 19 on the Lower North Shore, 38 on the Northern Beaches. Full method in each district report.
What the rest of spring has to show
We will not forecast spring. We can say what it has to do, and how we will know. On supply, the register points to fewer homes for sale than a normal spring. Owners who would have to sell at a loss mostly will not. On demand, Sydney’s auction clearance rate sat near 54 per cent in the third week of September. A year earlier it was almost four in five. And a fourth rate rise is widely expected. At open homes on the Upper North Shore and the Beaches, more buyers have come back in the last fortnight. That is a field note, not a statistic.
So here is spring’s test, set down before the season can influence it. In each district, winter’s sellers set a mark. It is 2.5 per cent on the Upper North Shore, 1.5 per cent on the Lower North Shore and 3.1 per cent on the Beaches. If spring’s sellers do better than that, on the same test with the same exclusions, the season worked. The first reading comes in November, and the full season by the end of the year.
Read the detail, district by district
Each district report carries the full test and a suburb-by-suburb table of prices and values. It also covers what the numbers mean if you are upsizing, downsizing or buying your first home.
Upper North Shore house prices, spring 2026: ten suburbs from Roseville to Hornsby. The squeeze is in the family band, the dearest suburbs held, and the very top kept selling.
Lower North Shore house prices, spring 2026: 19 suburbs from Mosman to Lane Cove. The squeeze starts at $1.5 million, the harbour suburbs fell furthest, and the Chatswood side held.
Northern Beaches house prices, spring 2026: 38 suburbs from Manly to Palm Beach. The squeeze is in the family band, the Manly end and flats held, and the fall deepened into August.
Where this leaves us
Three districts, one winter, and three different springs ahead. The fall is real and it is the same size everywhere. But where it lands depends on the price band, the suburb, and whether you own a house or a flat. That is why a regional headline is rarely enough to act on. For the North Shore, start with our North Shore service page. For the Beaches, our work as Northern Beaches buyers agents starts on our home page. If you are weighing a move this spring, talk it through with us, using the numbers rather than the headlines.
About the author
Mike Kaye is Co-Founder and Director of Sarah Kaye & Co., a director-led independent buyers’ agency for Sydney’s Northern Beaches, Upper North Shore, and Lower North Shore. A former Accenture Global Partner and Graduate of the Australian Institute of Company Directors (GAICD), with formal qualifications in property law, valuation, and economics, Mike advises clients on disciplined property acquisition, risk management, and long-term capital protection. This report is the hub of the Sarah Kaye & Co Research spring 2026 series; the three district reports carry the detail.
Methodology and sources
This article summarises three district reports published by Sarah Kaye & Co Research in September 2026, each with its own full methodology. Settled sales and resales: NSW Valuer General Property Sales Information (Land Registry Services), as at the 21 September 2026 weekly release; ten Upper North Shore suburbs, 19 Lower North Shore suburbs and 38 Northern Beaches suburbs. Arm’s-length sales only, $400,000 and above. Resale pairs match the same property across two consecutive sales (houses by the register’s property identifier; units by that identifier and the unit’s address, because every unit in a strata building shares one identifier). Holds under 18 months, gains above 60 per cent and non-round prices on either sale are excluded. The Lower North Shore and Northern Beaches reports also exclude commercial lots; the Upper North Shore report does not, which moves its figures by less than half a point. Winter is contracts dated 1 June to 31 August; winter sales counts are lag-matched to 3 September. Suburb values: Cotality (RP Data) suburb statistics reports prepared 24 September 2026; district value changes are sales-weighted across suburbs with 20 or more sales a year of that type, houses and units measured separately (Upper North Shore: a nine-suburb index). Sydney-wide figures and clearance rates: Cotality Home Value Index (September 2026) and weekly auction reporting to 19 September 2026. Field observations are the firm’s own and are not statistics.