
Sarah Kaye & Co Research
The headlines say Sydney is in a reckoning. We followed the same Lower North Shore homes through two sales to see what sellers really got this winter, which suburbs fell most, and what that means for spring.
If you own a home on the Lower North Shore, September’s newspapers will not have made comfortable reading. Sydney values are seven per cent off their February peak. Sydney’s auction clearance rate has spent most of winter near half, against almost four in five at this time last year. Some of that is true here. Some of it is not. This report sorts one from the other, suburb by suburb, using the one source nobody can massage.
That source is the register: the NSW Valuer General’s record of every settled sale in the state. It runs a few weeks behind the market, because a sale only appears once it has settled and been lodged. But it is the truth of what changed hands and for how much. Here, three in four sales are units, which sell all year round, so this district has never had much of a spring surge. This time we do something new with the register. We followed the same homes through two sales.
What winter’s sellers actually got
Here is the test. Take every home in our 19 suburbs that sold this winter. Keep only the ones that had also sold between eighteen months and five years earlier. That lets us compare two prices for the same home. Then drop anything that was not an ordinary sale between strangers. Drop anything resold inside eighteen months, which is usually a renovation flip. Drop anything with a gain so large it must have been rebuilt. What is left is about 5,000 clean pairs since 2012. It is the cleanest price test the register can give.
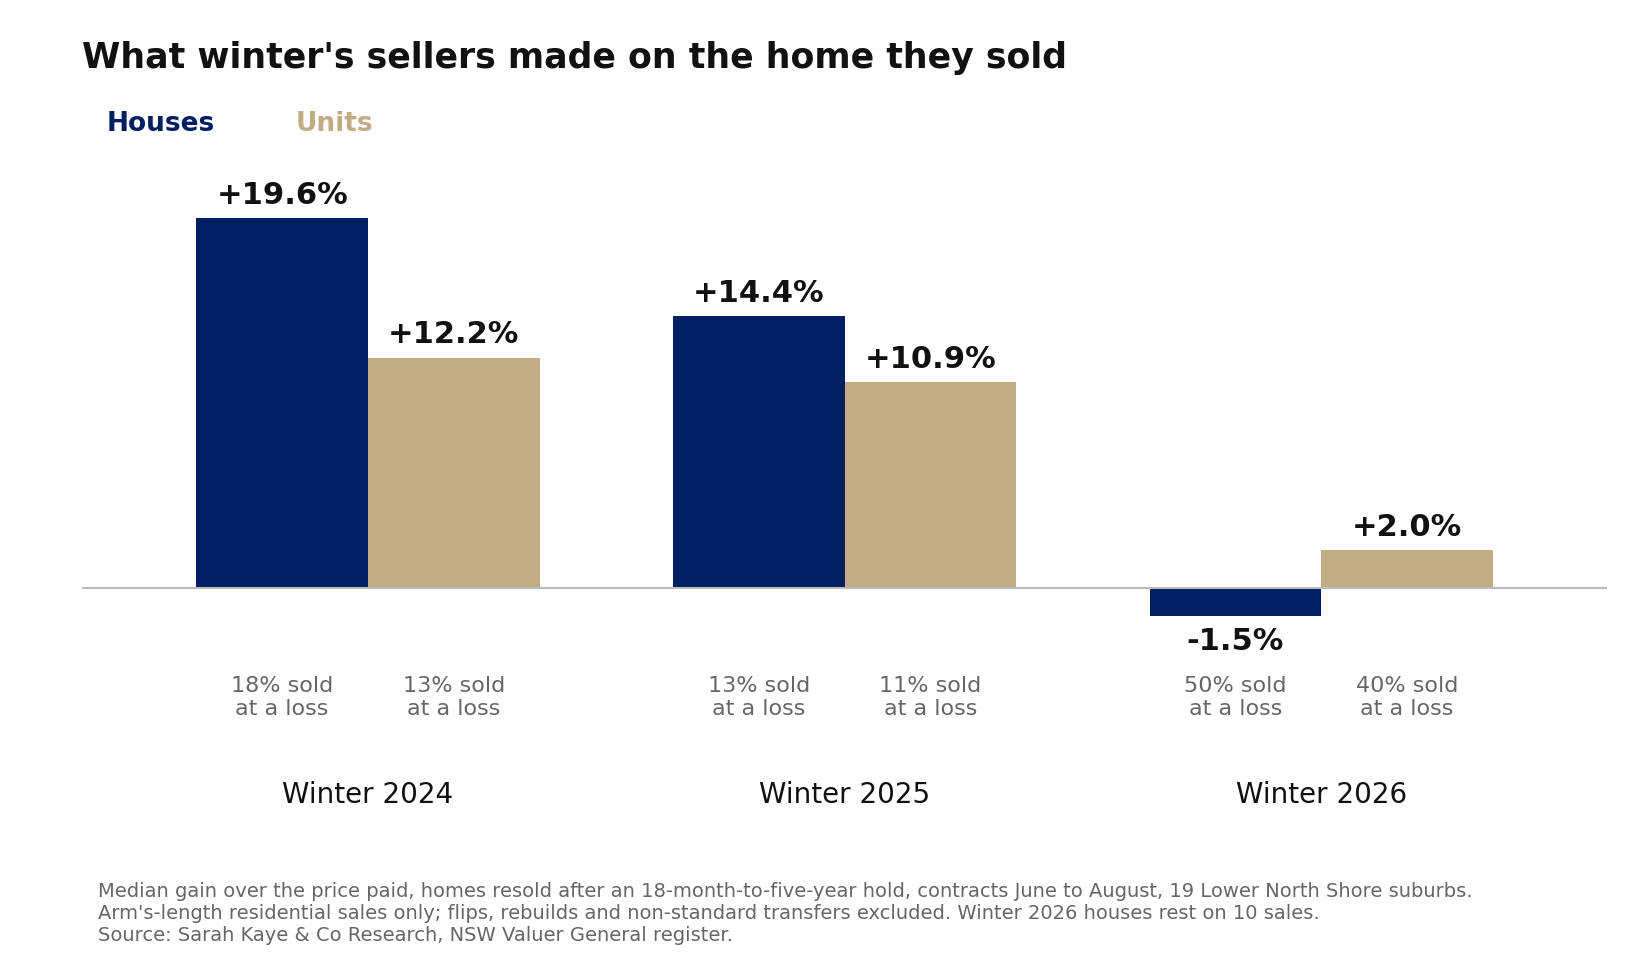
Last winter, the typical seller made 11 per cent on what they had paid. The winter before, 13 per cent. This winter, 1.5 per cent. Two in five sold for less than they paid. For houses, the typical gain went from 14 per cent to a small loss, and half the sellers took a loss. That rests on only ten house sales, so read it as a direction. Units matter more here, because they are three in four sales. Their typical gain fell from 11 per cent to 2 per cent. The share selling at a loss went from about one in nine to two in five.
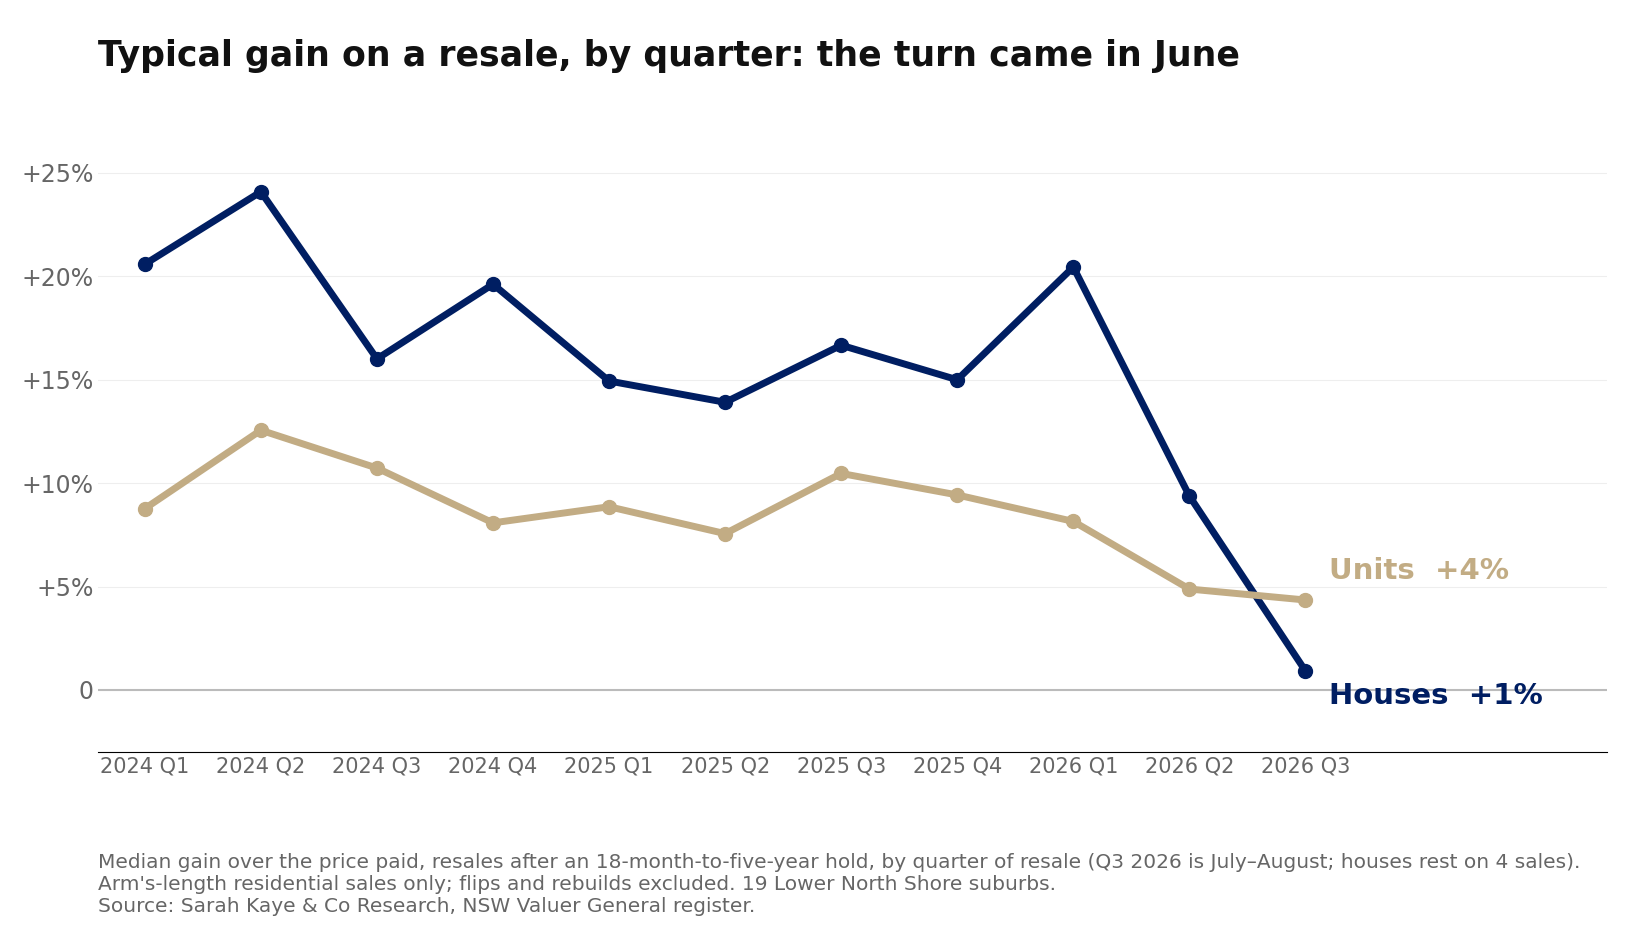
The turn was quick, and the register dates it. In the March quarter, sellers were still making 12 per cent, much as they had for three years. In the June quarter the typical gain fell to 5.5 per cent, and three in ten sold at a loss. July and August so far read lower again, at about 4 per cent, on 27 sales. As on the Upper North Shore, the change came between April and June, after the first two rate rises and the May Budget.
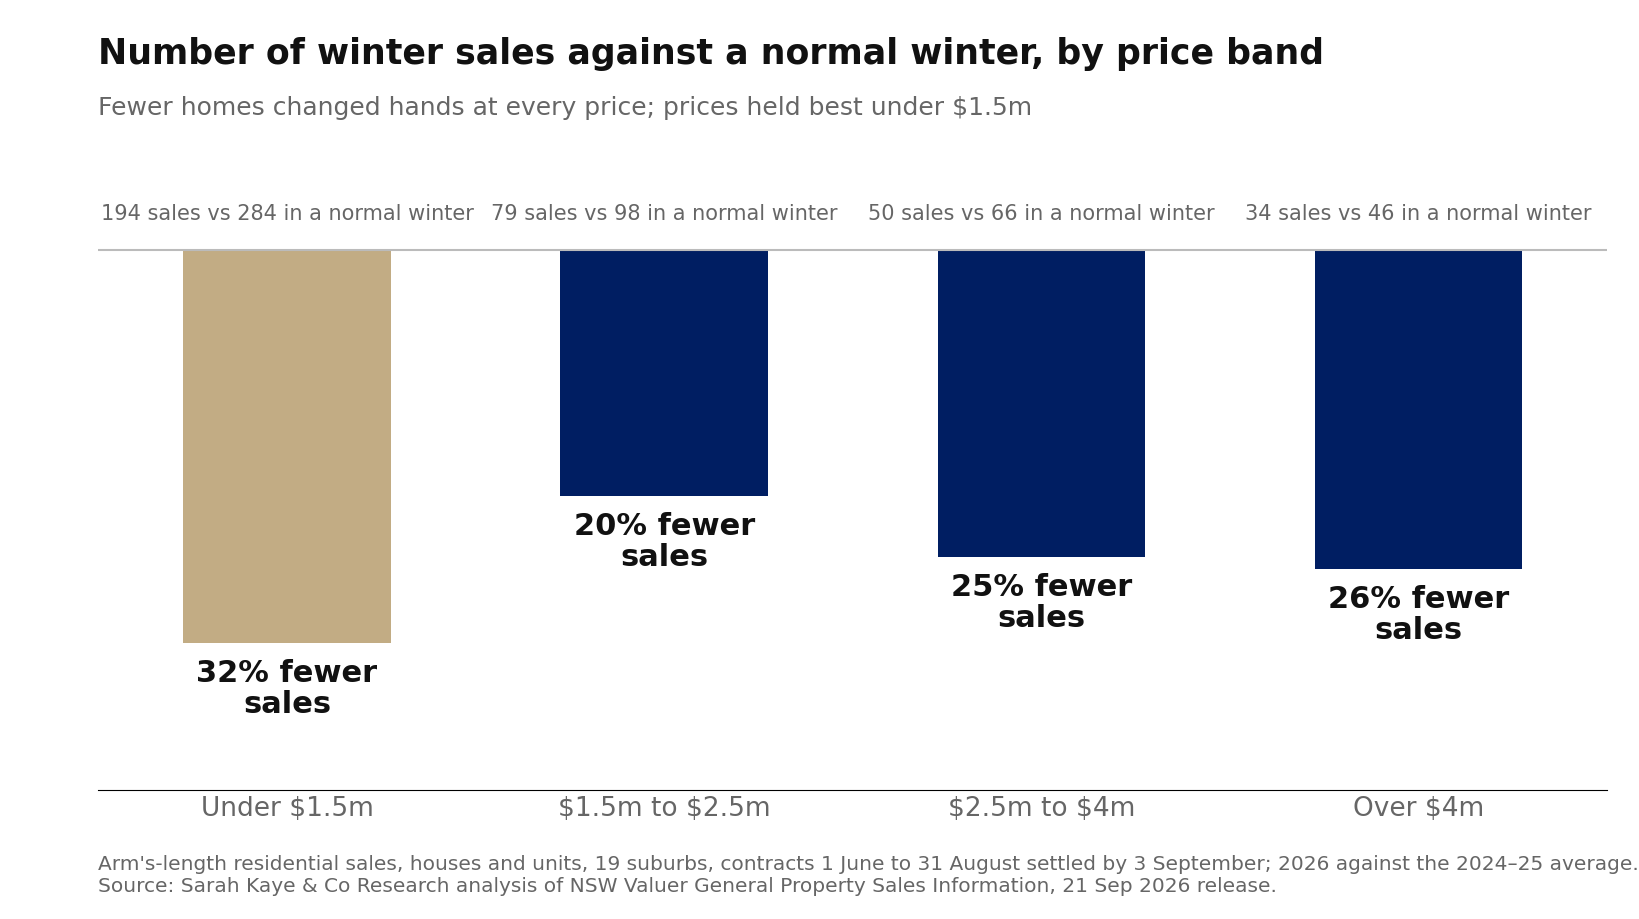
Winter also traded thin. Comparing identical windows, the 19 suburbs settled 357 sales this winter. The two winters before gave 492 and 497. That is a 28 per cent shortfall, deeper than the Upper North Shore’s 18. Unit sales fell 29 per cent and house sales 23. Fewer homes sold, and the ones that did sold for little gain. That is the record spring starts from.
Who can afford to sell this spring
The same test tells you something the listings portals cannot: who is in a position to sell. Most owners here still can. Those who bought in 2021, 2022 or 2023 and sold this year came out six to eleven per cent ahead. They are the upsizers we meet at open homes across the Lower North Shore. Those who bought in 2024 made about five per cent, but one in three sold at a loss. For unit owners who bought in 2024, it was two in five. Most people in that position will stay put unless a job, a baby or a separation forces the issue.
So expect a spring with fewer homes for sale than the calendar suggests, and fewer flats in particular. Most will be sold by people who have owned for a while. That is not a forecast from a model. It is what the register says about the people who would have to do the selling.
The squeeze starts at $1.5 million
Now split the sellers by what they paid. Under $1.5 million, where most units sit, the typical gain eased from 11 per cent last year to 7 per cent this year. About one in five sold at a loss. From $1.5 million up, the gain fell from 10 per cent to 6, and one in three sold at a loss. Over $4 million it fell furthest, from 12 per cent to under 4, with nearly two in five at a loss, on only 16 sales. On the Upper North Shore the line sat at $2.5 million. Here it sits lower.
Sales fell in every price band, by 20 to 32 per cent on a normal winter. The biggest fall was under $1.5 million, where prices held best. Fewer owners chose to sell.
Cotality’s suburb figures show where the pressure sits on the map. Cotality, which many readers will know as RP Data, publishes a monthly estimate of the median home value in each suburb. It is a model, not a sale, so we use it to add detail to the register rather than to replace it. On its reading the harbour suburbs fell hardest over the year to August. Mosman houses are down 19 per cent, Neutral Bay and Cammeray 17, Cremorne and North Sydney 13. The Chatswood side barely moved: Willoughby down 8, Artarmon 7, Chatswood flat. Overall, house values fell 14 per cent from September and unit values 7, almost all of it since February.
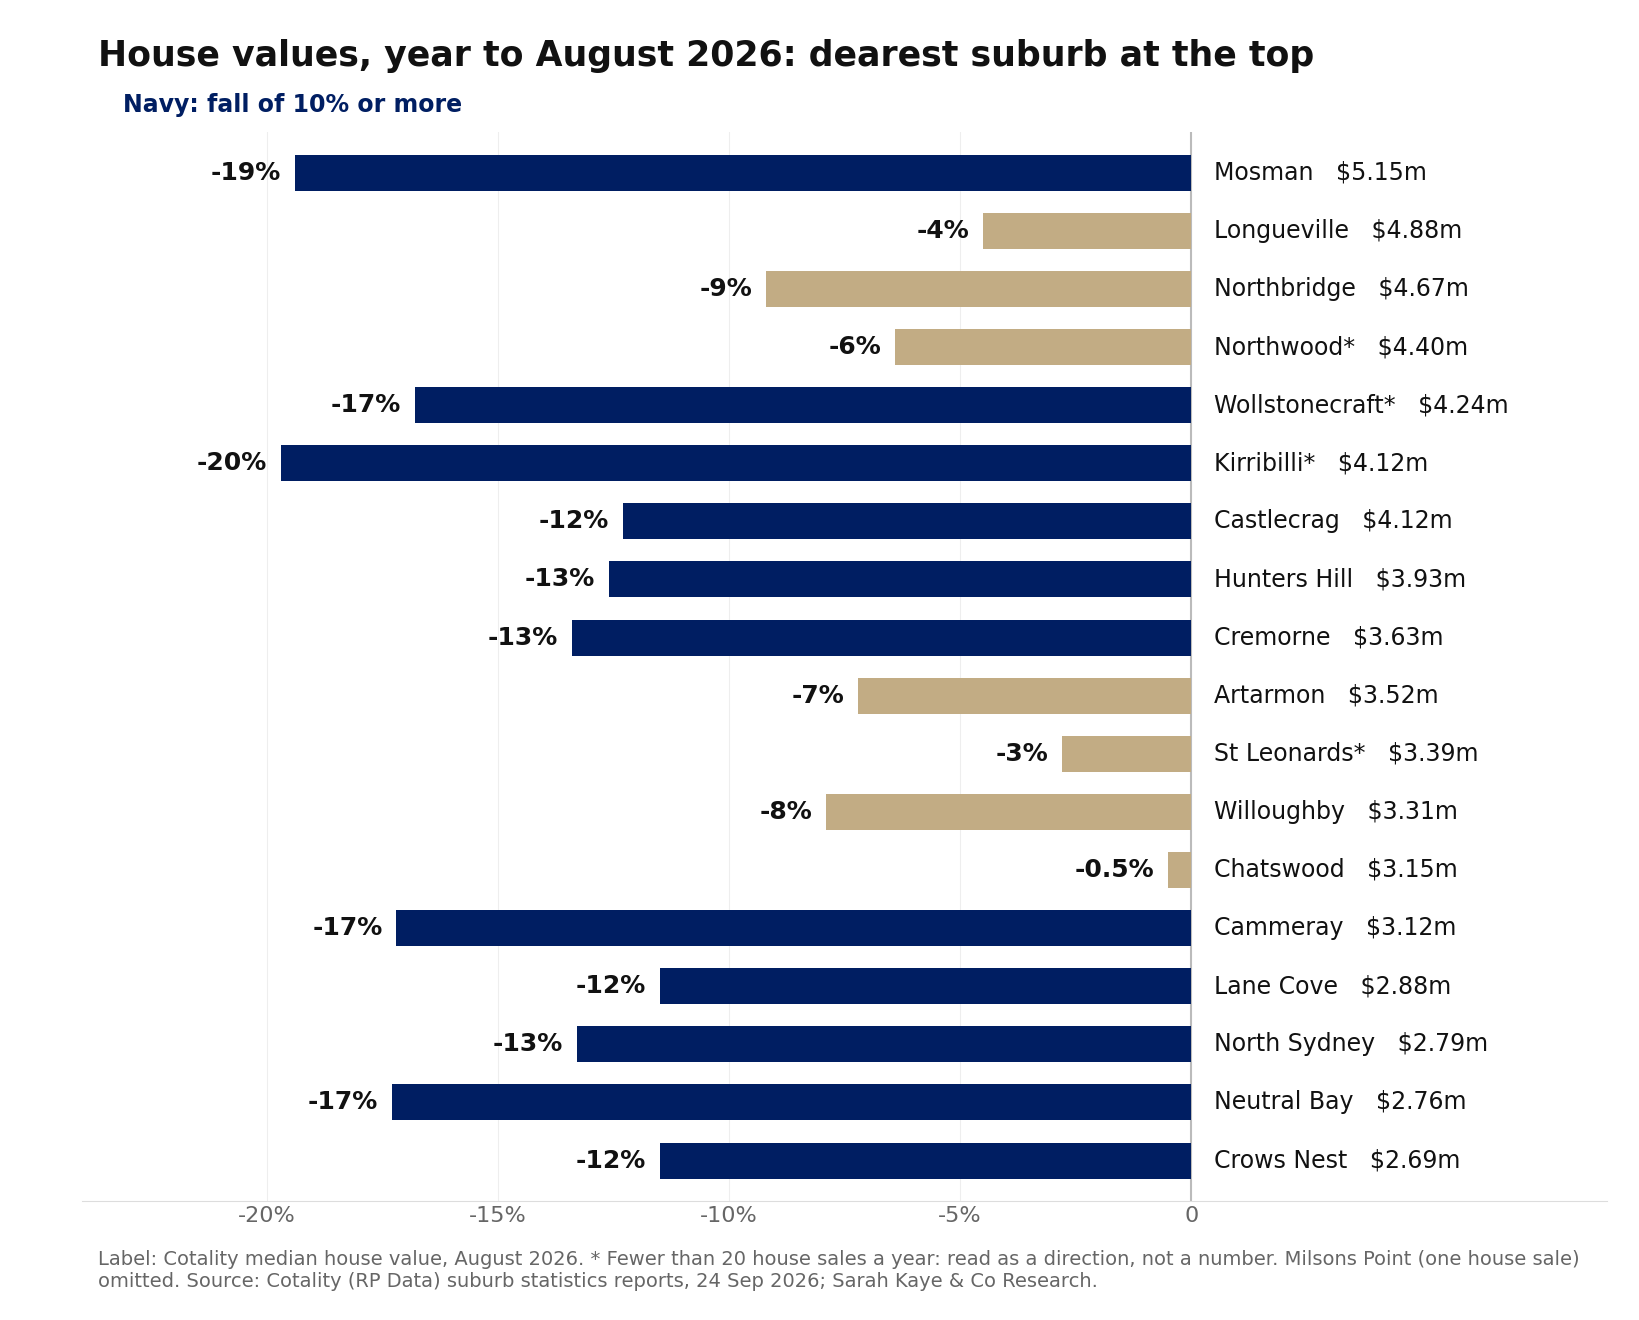
Those falls are larger than the register shows. The register’s median house sale across the 19 suburbs slipped only two per cent over the year, from $4.12 million to $4.03 million. So we read Cotality for the direction and the order of the suburbs, not the exact size. Time on market points the same way for units. Flats took longer to sell in most suburbs, Lane Cove from 29 days to 40 and Willoughby from 25 to 34. House selling times show no clear change. People can only pay what they can borrow, and three rate rises this year hit the family with the big mortgage first. And for perspective, house values here are still 14 to 39 per cent above August 2020.
House and unit prices by Lower North Shore suburb
The table below sets out three things for each suburb. First, the median sale price for houses and units over the year to August, from the register. Second, Cotality’s estimate of the median home value at August 2026, with its twelve-month change. Third, days on market. The two price columns differ on purpose. The median sale price is the middle of what actually sold. It moves with the mix: a year with more big blocks sold looks dearer, even if no home rose. The Cotality value estimates what all homes in the suburb are worth. It moves with prices rather than with the mix, but it is a model and it revises. Where the two agree, trust the number. Where they differ, the gap usually tells you the mix changed.
House and unit prices by Lower North Shore suburb, spring 2026
| Suburb | House median sale, yr to Aug | House value, Aug 2026 | 12-mth change | House days on market | Unit median sale, yr to Aug | Unit value, Aug 2026 | 12-mth change | Unit days on market |
|---|---|---|---|---|---|---|---|---|
| Mosman | $5.34m | $5.15m | −19.4% | 40 | $1.40m | $1.35m | −11.0% | 38 |
| Longueville | $4.50m | $4.88m | −4.5% | 37 | – | – | – | – |
| Northbridge | $5.32m | $4.67m | −9.2% | 50 | $1.21m | $1.28m | −13.0% | 48 |
| Northwood | $6.47m* | $4.40m* | −6.4% | 36 | – | – | – | – |
| Wollstonecraft | $5.00m* | $4.24m* | −16.8% | 23 | $1.35m | $1.27m | −5.2% | 28 |
| Kirribilli | $4.20m* | $4.12m* | −19.7% | – | $1.48m | $1.56m | −7.7% | 31 |
| Castlecrag | $4.59m | $4.12m | −12.3% | 39 | – | – | – | – |
| Hunters Hill | $4.46m | $3.93m | −12.6% | 41 | $1.07m | $1.05m | −14.9% | 70 |
| Cremorne | $4.10m | $3.63m | −13.4% | 45 | $1.41m | $1.30m | −10.1% | 29 |
| Artarmon | $3.62m | $3.52m | −7.2% | 44 | $1.10m | $1.04m | −2.5% | 48 |
| St Leonards | – | $3.39m* | −2.8% | – | $1.20m | $1.13m | −4.7% | 69 |
| Willoughby | $3.88m | $3.31m | −7.9% | 36 | $1.50m | $1.14m | −5.5% | 34 |
| Chatswood | $3.44m | $3.15m | −0.5% | 42 | $1.17m | $1.11m | −4.5% | 40 |
| Cammeray | $3.67m | $3.12m | −17.2% | 36 | $1.30m | $1.31m | −4.0% | 14 |
| Lane Cove | $3.15m | $2.88m | −11.5% | 28 | $0.96m | $0.95m | −3.1% | 40 |
| North Sydney | $3.67m | $2.79m | −13.3% | 28 | $1.20m | $1.20m | −6.7% | 40 |
| Neutral Bay | $2.85m | $2.76m | −17.3% | 26 | $1.35m | $1.20m | −8.6% | 37 |
| Crows Nest | $2.73m | $2.69m | −11.5% | 42 | $1.03m | $1.09m | −4.9% | 33 |
| Milsons Point | – | – | – | – | $2.40m | $1.98m | −0.9% | 52 |
Median sale prices are from the register: arm’s-length residential sales of $400,000 and above, contracts September 2025 to August 2026. Values are Cotality’s monthly median value estimates at August 2026, with the change on August 2025. Days on market is Cotality’s rolling twelve-month median. * Fewer than 20 sales in the year: read as a direction, not a number. – Fewer than five sales, or no reading. Suburbs are ordered by Cotality house value.
Two things stand out. First, Mosman. The register shows a median house sale of $5.34 million, 11 per cent below last year. Cotality puts the fall at 19 per cent. Both say Mosman houses are the weakest large market on the Lower North Shore. Second, the Chatswood side held. Chatswood house values are flat on the year and the register median rose three per cent. Willoughby and Artarmon fell less than half as far as the harbour suburbs.
What we see at the door
As Lower North Shore buyers agents we are searching for several clients above $10 million, so here is a field note, and it is only that. There is not much on the market at that level, and not many other buyers looking. Twice this season, an agent has come back to us weeks after an inspection with a price about 20 per cent lower, if our client could settle quickly. The register backs the first part. Sales above $10 million contracted from January to August and settled by mid-September number 12 this year, against 27 to 37 in each of the four years before. The register cannot check the second: it records sale prices, not offers. Cotality’s 19 per cent fall in Mosman house values is the same order. For how the two halves of the North Shore compare, see our North Shore service page.
What the newspapers say, and what holds here
We read the same papers you do, and the Financial Review’s property coverage this month has been better than most. Four of its themes deserve a local check. First, that Sydney is down seven per cent from its peak. Cotality says the Lower North Shore fell further, most of it since February, though the register’s own median moved less. Second, that the top end is falling fastest. That holds here, unlike on the Upper North Shore: Mosman, the thin $10 million market and the resale losses over $4 million all say so. Third, that the affordable end is holding. True on price: flats under $1.5 million still resold for a gain. Not on volume, which fell most there. Fourth, that spring has opened thin, with buyers waiting on the Reserve Bank. That matches what we see, and a register that shows fewer people choosing to sell.
Spring so far, and spring’s test
The register cannot see spring yet. Homes that sold in the first half of September and had settled by the latest weekly update number between none and three in each of the past four years. The first proper reading arrives with the late October updates. The live signs say the season opened thin but not dead. Sydney’s clearance rate sat near 54 per cent in the third week of September as more homes went to auction. In most years this district barely has a spring, because flats sell all year round. The tell this year is whether unit sales pick up from winter’s low.
So here is spring’s test, on the record before the season can influence it. Winter’s sellers made 1.5 per cent and two in five took a loss. If spring’s sellers do better than that, on the same test with the same exclusions, the season worked. The first reading comes in November.
If you are hoping to upsize
The gap has narrowed. The house you want has lost more value than the flat you would sell: Cotality has houses down 14 per cent since September and units down 7. But your flat is also slower to sell than it was. A fourth rate rise is widely expected, and each one shrinks the loan that bridges the gap. Sell first or buy first is a real question here, so do the borrowing sums before the house hunt.
If you are weighing a downsize
The trade is fairer here than on the Upper North Shore. You would sell a house into the softest part of this market, but buy into a unit market where homes are taking longer to sell. That gives you time to choose and to negotiate. It can still be the right move for reasons no spreadsheet captures. Price your house from day one for the market you are in, and line up the purchase before you list.
If you are buying your first home, or a unit
Do not expect spring to hand you a big discount. Unit sale prices have sat between $1.25 million and $1.28 million for four years, and flats under $1.5 million still resold for a gain this winter. Cammeray and Wollstonecraft units sell in under a month. Where you do have an edge is on any flat that has sat for two months. Time is on your side there. Use it for due diligence, strata reports first, not just for negotiation.
Where this leaves us
The Lower North Shore is not one market. By price, the pressure starts at $1.5 million. By place, it sits on the harbour, where Mosman, Neutral Bay and Cammeray fell furthest, while the Chatswood side held. The top end is quiet and cheaper than it was. Winter is in the book. Spring is on the clock, with a rate decision attached. If you are weighing a move on the Lower North Shore this season, we are happy to talk it through against the numbers rather than the headlines. The Upper North Shore and Northern Beaches editions of this report carry the same test for their districts, and the three-district overview pulls the three together.
About the author
Mike Kaye is Co-Founder and Director of Sarah Kaye & Co., a director-led independent buyers’ agency for Sydney’s Northern Beaches, Upper North Shore, and Lower North Shore. A former Accenture Global Partner and Graduate of the Australian Institute of Company Directors (GAICD), with formal qualifications in property law, valuation, and economics, Mike advises clients on disciplined property acquisition, risk management, and long-term capital protection. This report is part of the Sarah Kaye & Co Research spring 2026 series.
Methodology and sources
Settled sales and resales: Sarah Kaye & Co Research analysis of NSW Valuer General Property Sales Information (Land Registry Services); 19 Lower North Shore suburbs (Mosman, Cremorne, Neutral Bay, Cammeray, Kirribilli, Milsons Point, North Sydney, Wollstonecraft, Crows Nest, St Leonards, Artarmon, Chatswood, Willoughby, Northbridge, Castlecrag, Northwood, Longueville, Lane Cove, Hunters Hill), the suburbs for which Cotality reports were prepared, as at the 21 September 2026 weekly release. Arm’s-length residential sales only (no low-value, bulk, commercial or non-standard transfers), $400,000 and above. Resale pairs match the same property across two consecutive sales: houses by the register’s property identifier, units by that identifier and the unit’s address, because every unit in a strata building shares one identifier. Holds under 18 months (possible flips), gains above 60 per cent (likely rebuilds) and non-round prices on either sale (possible related-party transfers) are excluded, leaving 5,058 pairs since 2012. Winter figures are contracts dated 1 June to 31 August of each year; the 2026 winter reading rests on 57 pairs (10 houses, 47 units) and the June quarter on 84, so both are treated as directional. Winter sales counts are lag-matched: contracts 1 June to 31 August settled by 3 September of the same year, 2026 against 2024 and 2025. Unit results in the St Leonards, Chatswood and Crows Nest tower suburbs were checked separately and do not drive any figure here. Sales above $10 million are contracts dated January to August and settled by 17 September of each year. Suburb values and days on market: Cotality (RP Data) suburb statistics reports prepared 24 September 2026; median values are Cotality’s monthly model estimates to August 2026 and are used as corroboration, not as the price source of record. The combined value change covers suburbs with 20 or more sales in the year, weighted by each suburb’s sales. Sydney-wide figures and clearance rates: Cotality Home Value Index (September 2026) and weekly auction reporting to 19 September 2026. Field observations are the firm’s own and are not statistics. The register will not show spring contracts in volume until late October.